Visualizing the Rijksmuseum
- Class Project
- Data Viz, Code
- 2017
Overview
In a Data Visualization course at Carnegie Mellon, for the final project, we were to find and visualize a dataset using d3.js. Our team was interested in the shift in how people were experiencing art as new initiatives spearheaded its digitization. We were inspired by innovative cultural projects, like those of Google's Arts & Culture. So, we chose to use The Rijksmuseum's newly released API, giving us full digital access to its collection in Amsterdam.
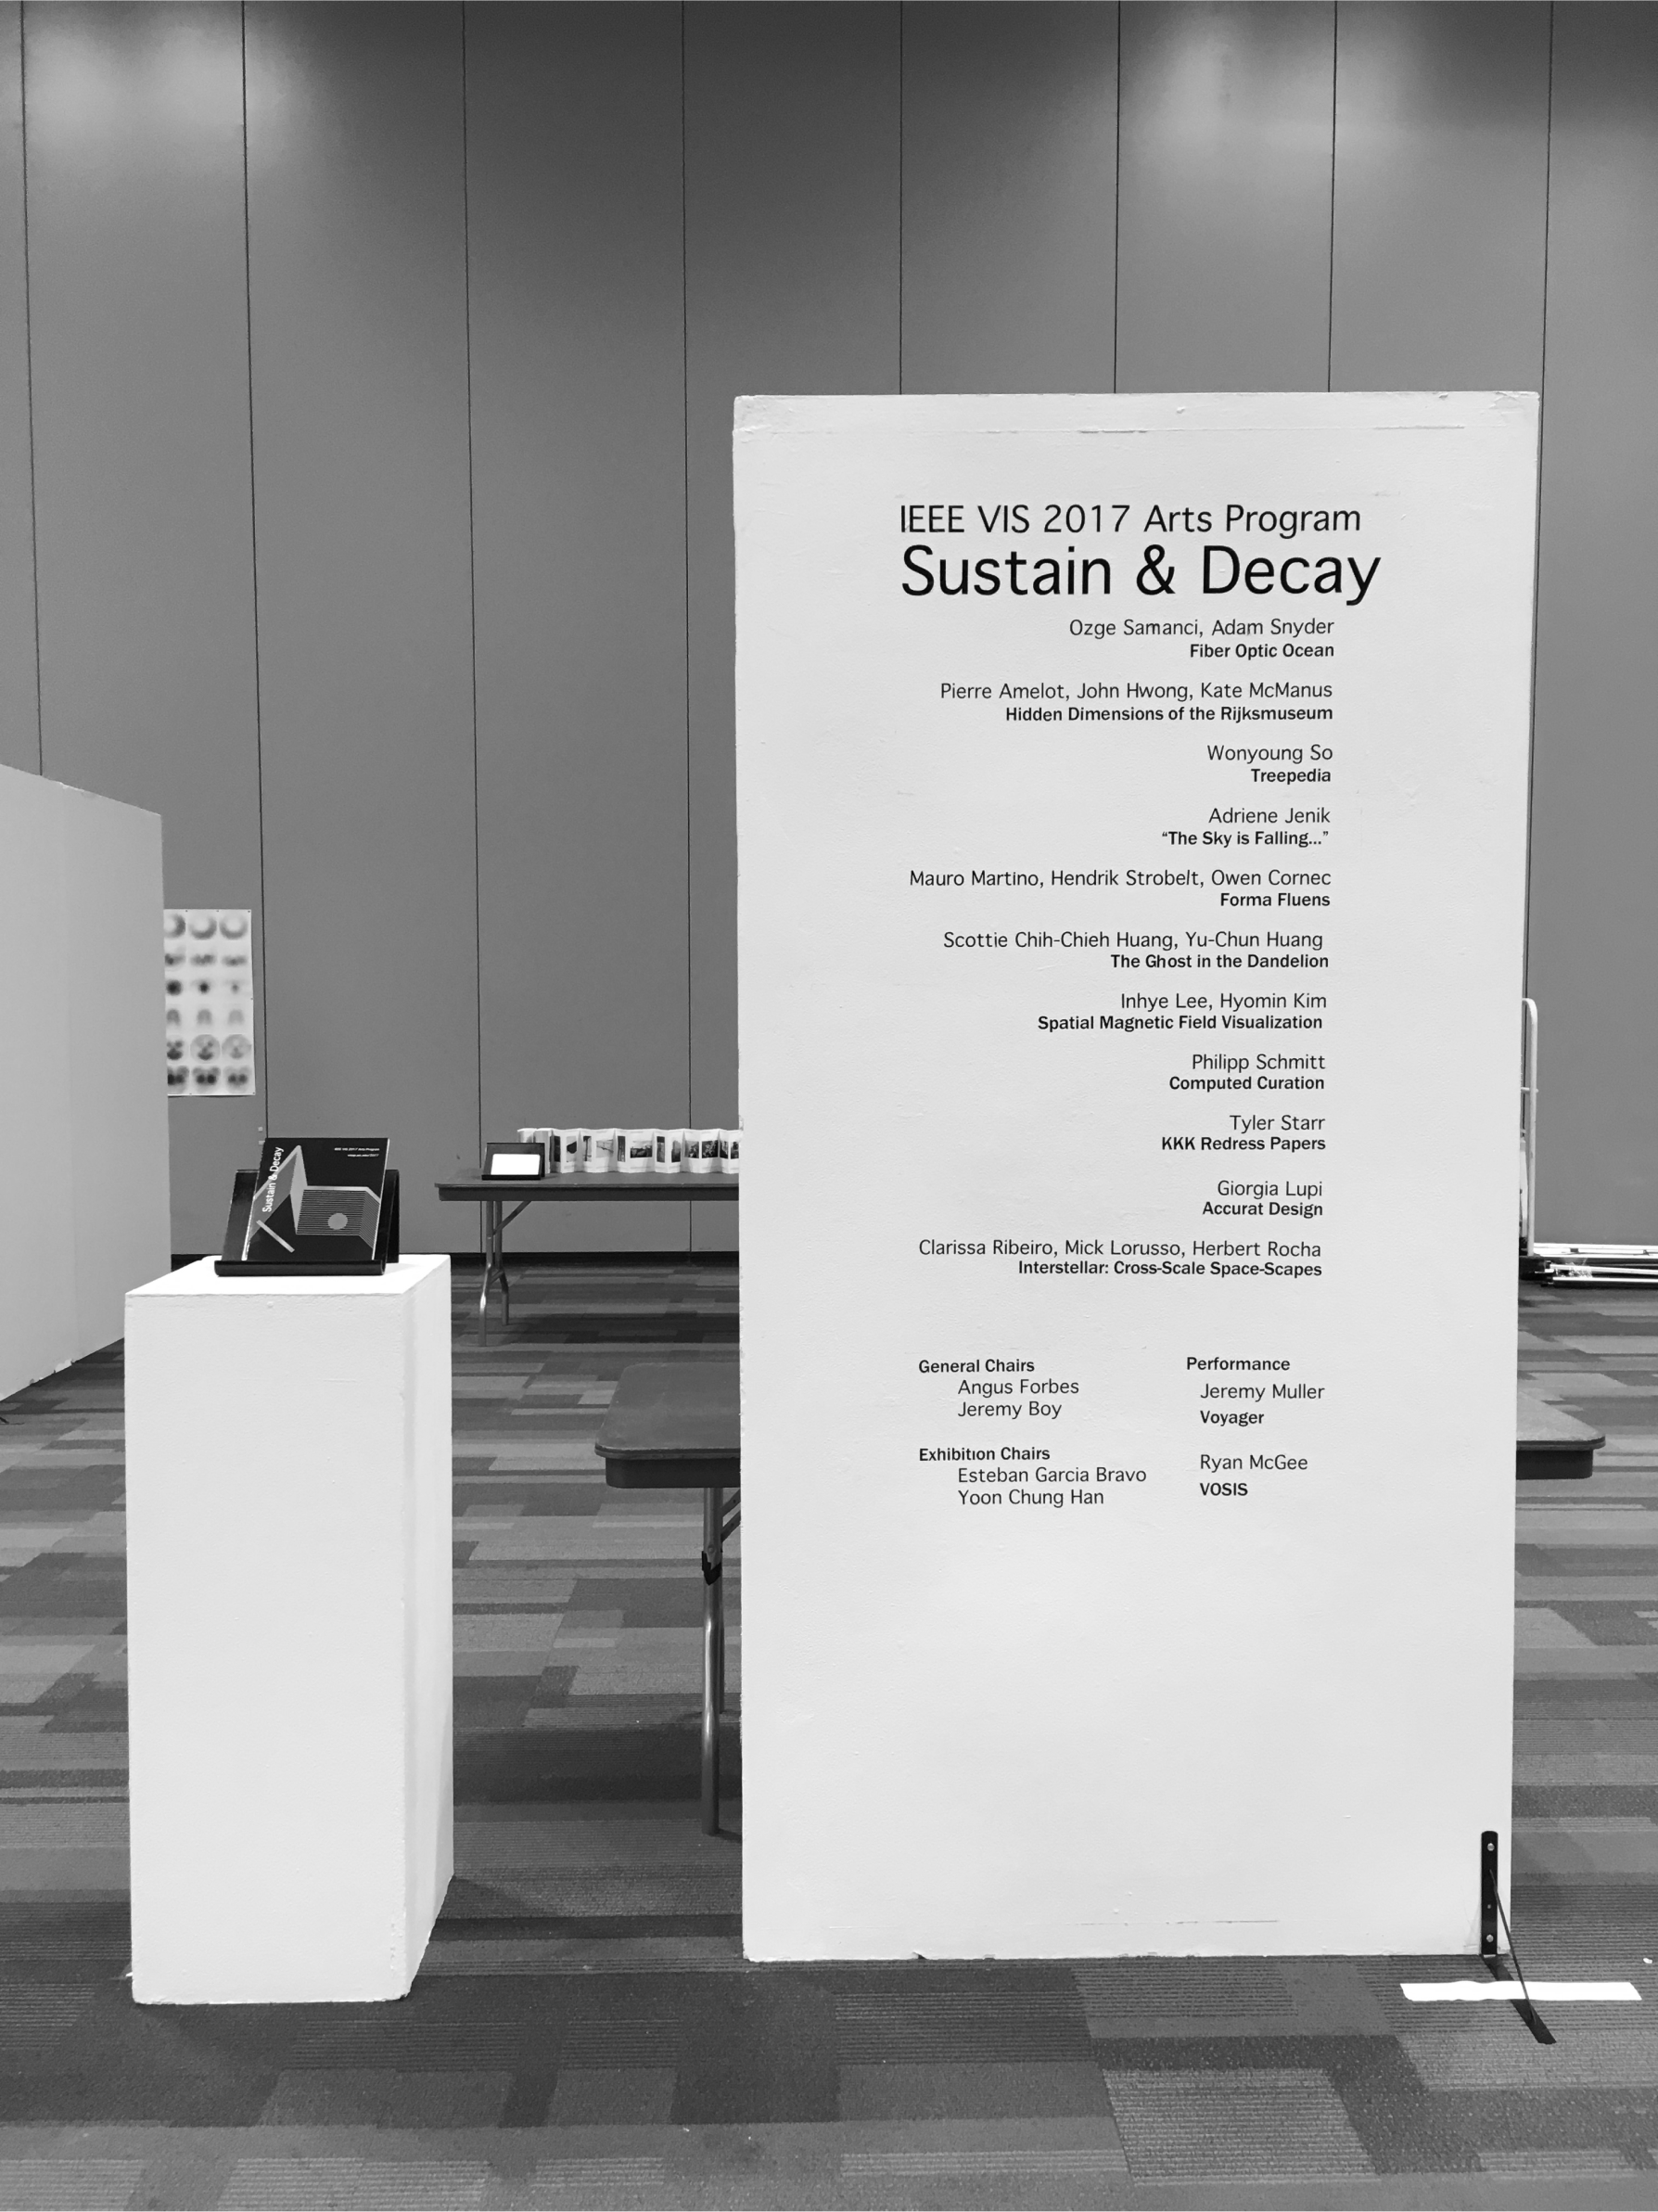
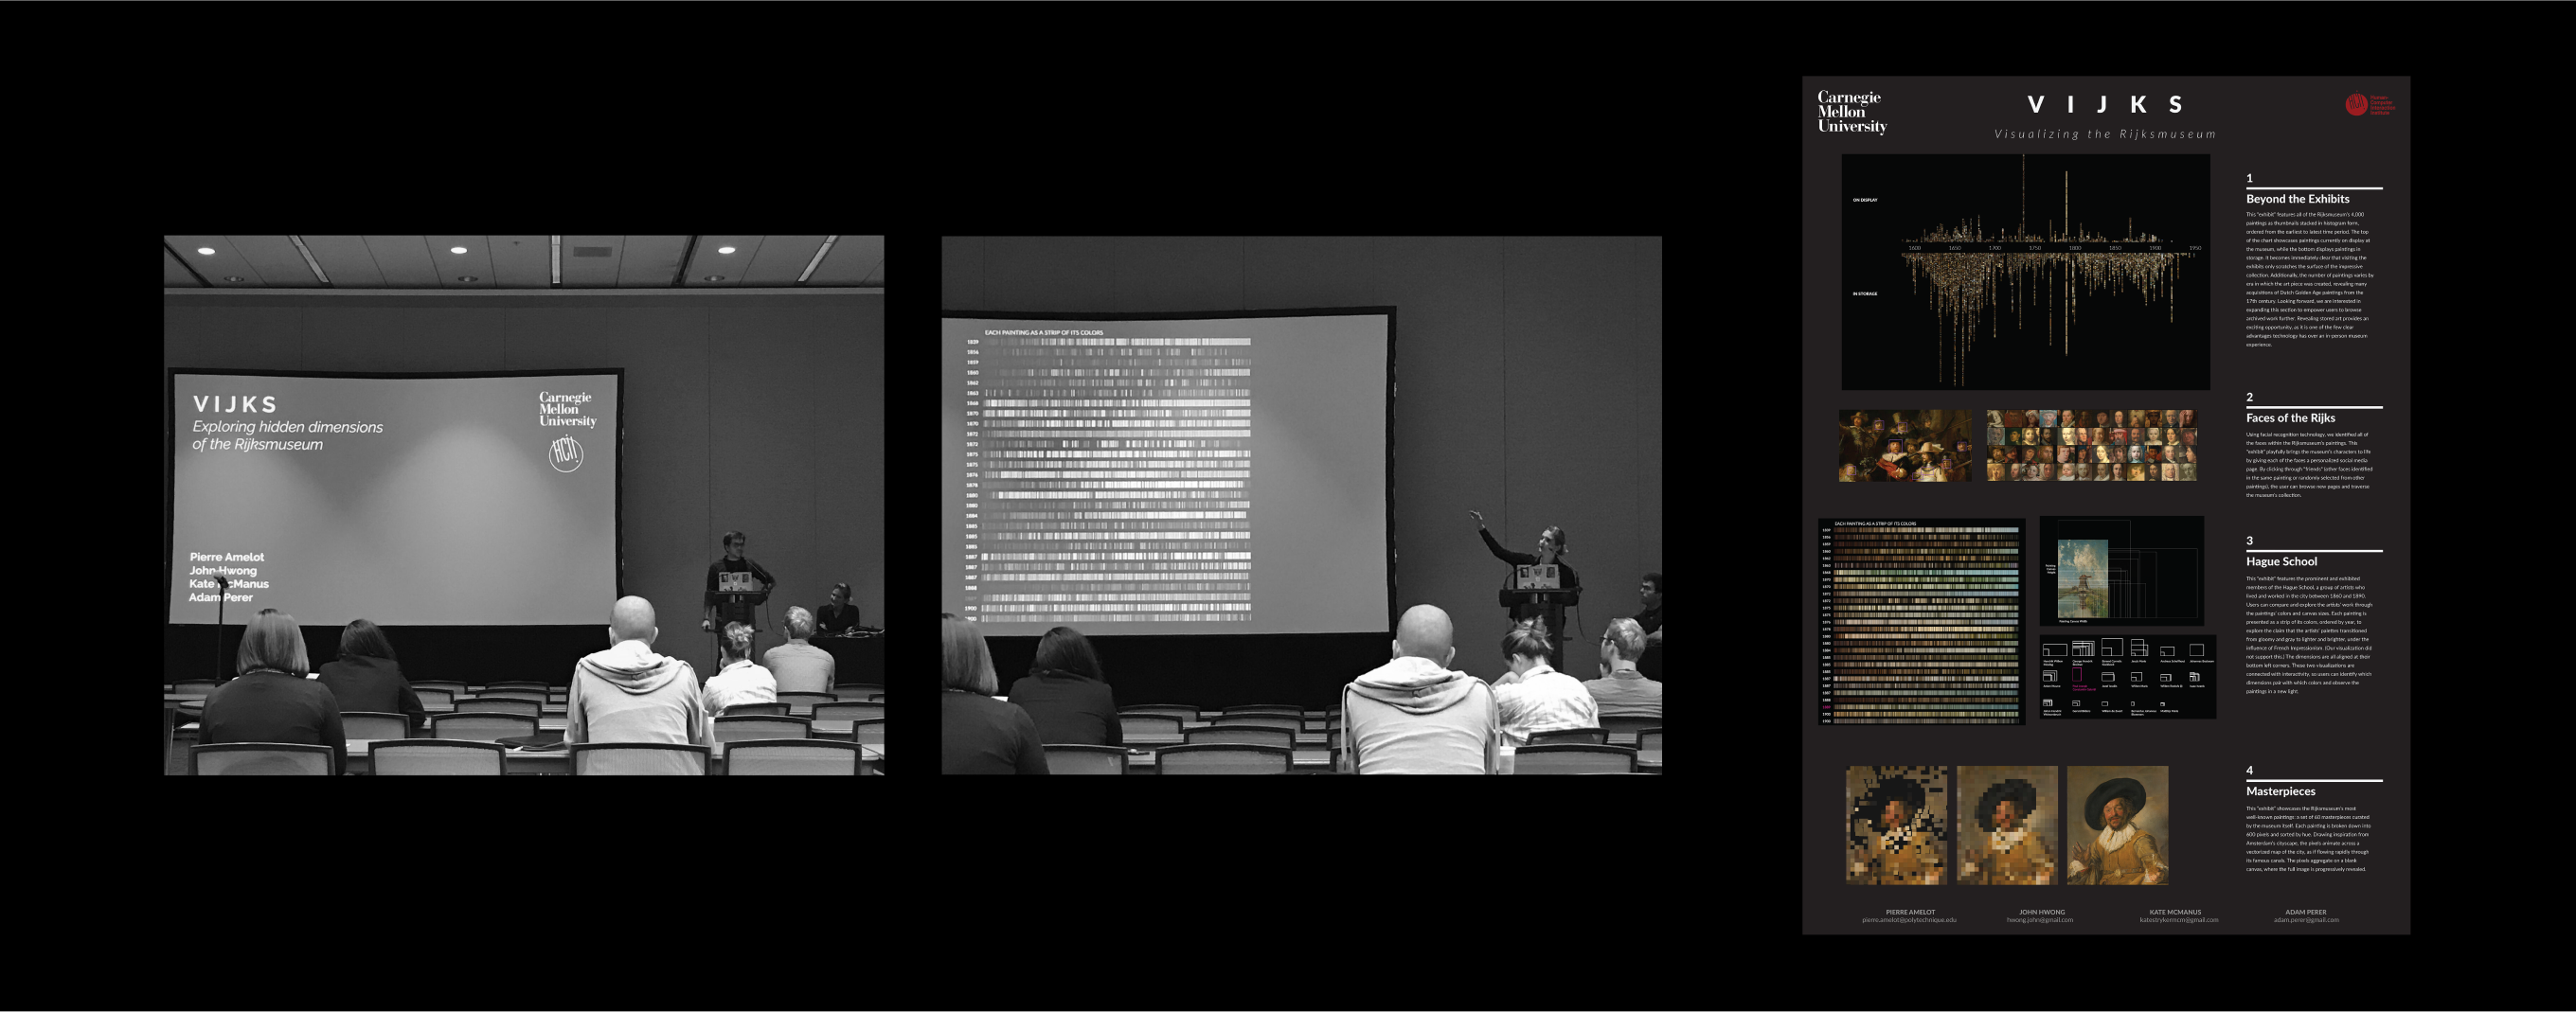
We submitted our project to the IEEE Visualization Conference, an annual conference on information visualization. We were selected to share our work in a presentation, poster, and public art installation for the Vis Arts Program, alongside famous information designers such as Giorgia Lupi.
Goal
How can users experience the Rijksmuseum's art remotely in new ways that are not available through a museum visit? Our project encompassed 4 virtual “exhibits,” or attempts to answer that question.
Team
Pierre Amelot, John Hwong
Process
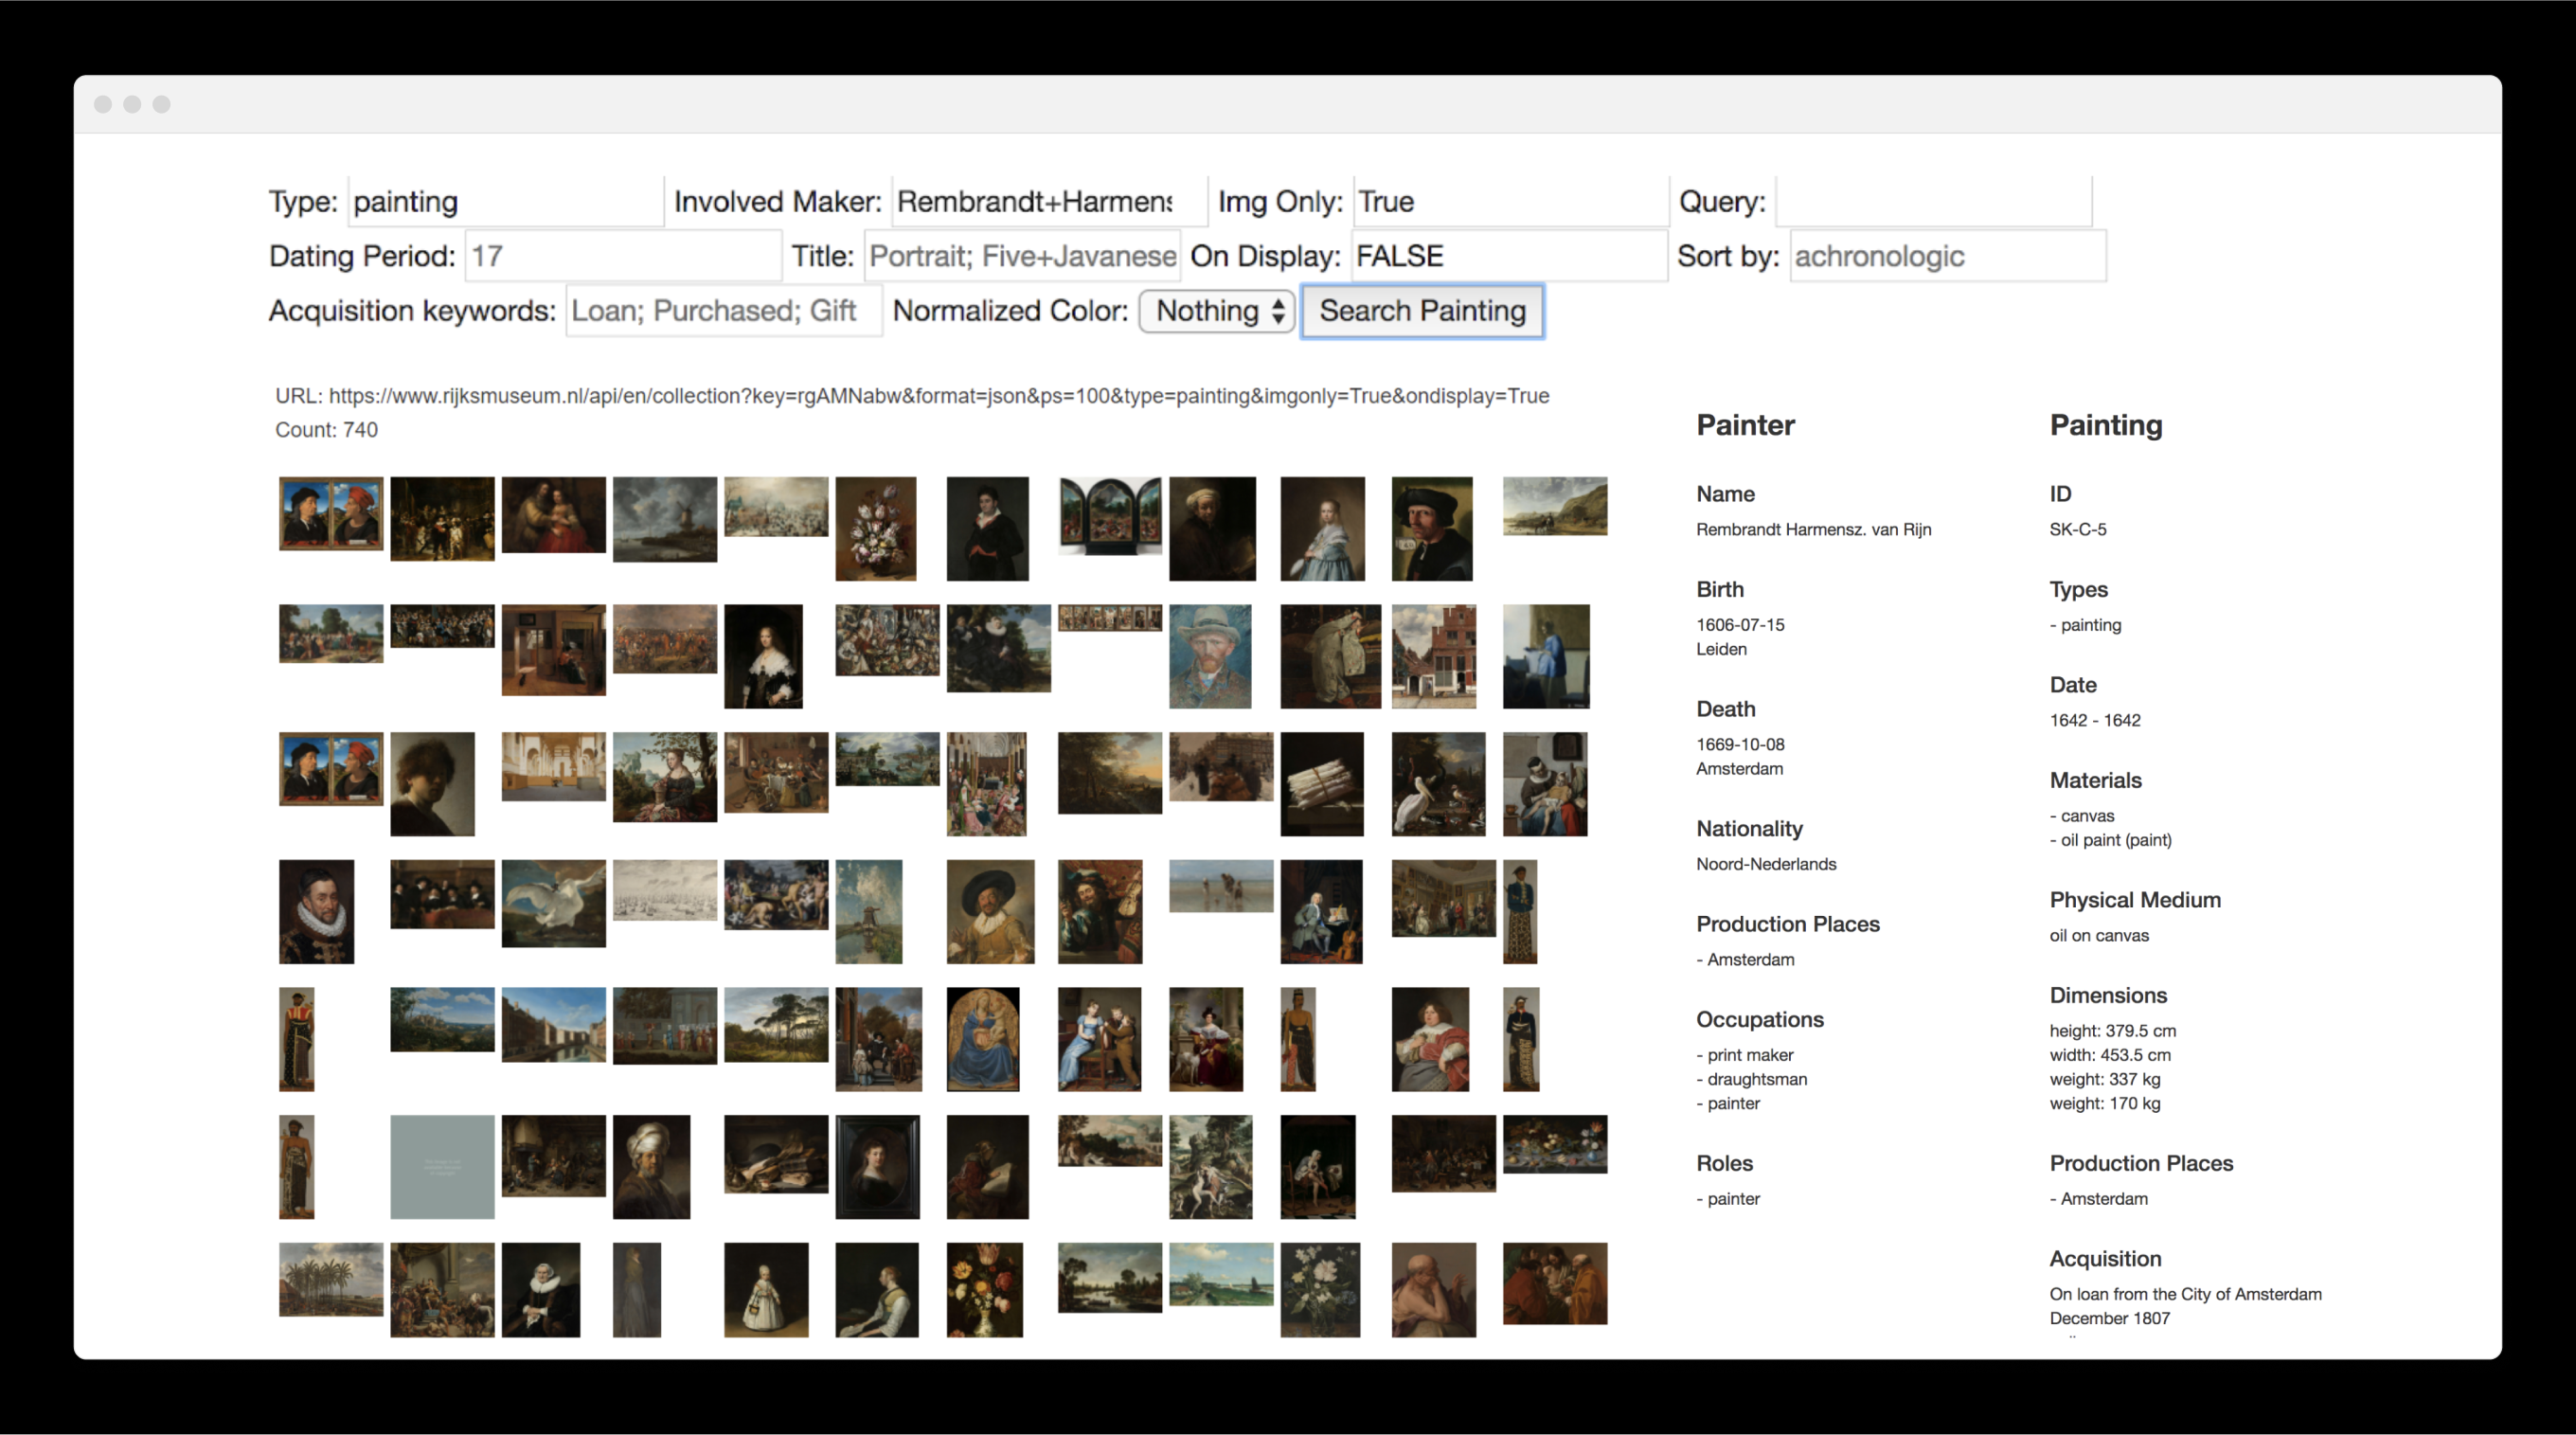
To acquaint ourselves with the data, we created an internal interface to query the API, present the artworks, and filter by their attributes. Equipped with this reference, we brainstormed visualizations, usually by sketching on paper. We roughly prototyped our more compelling ideas within the interface, later refining the best of them.
Exhibit I
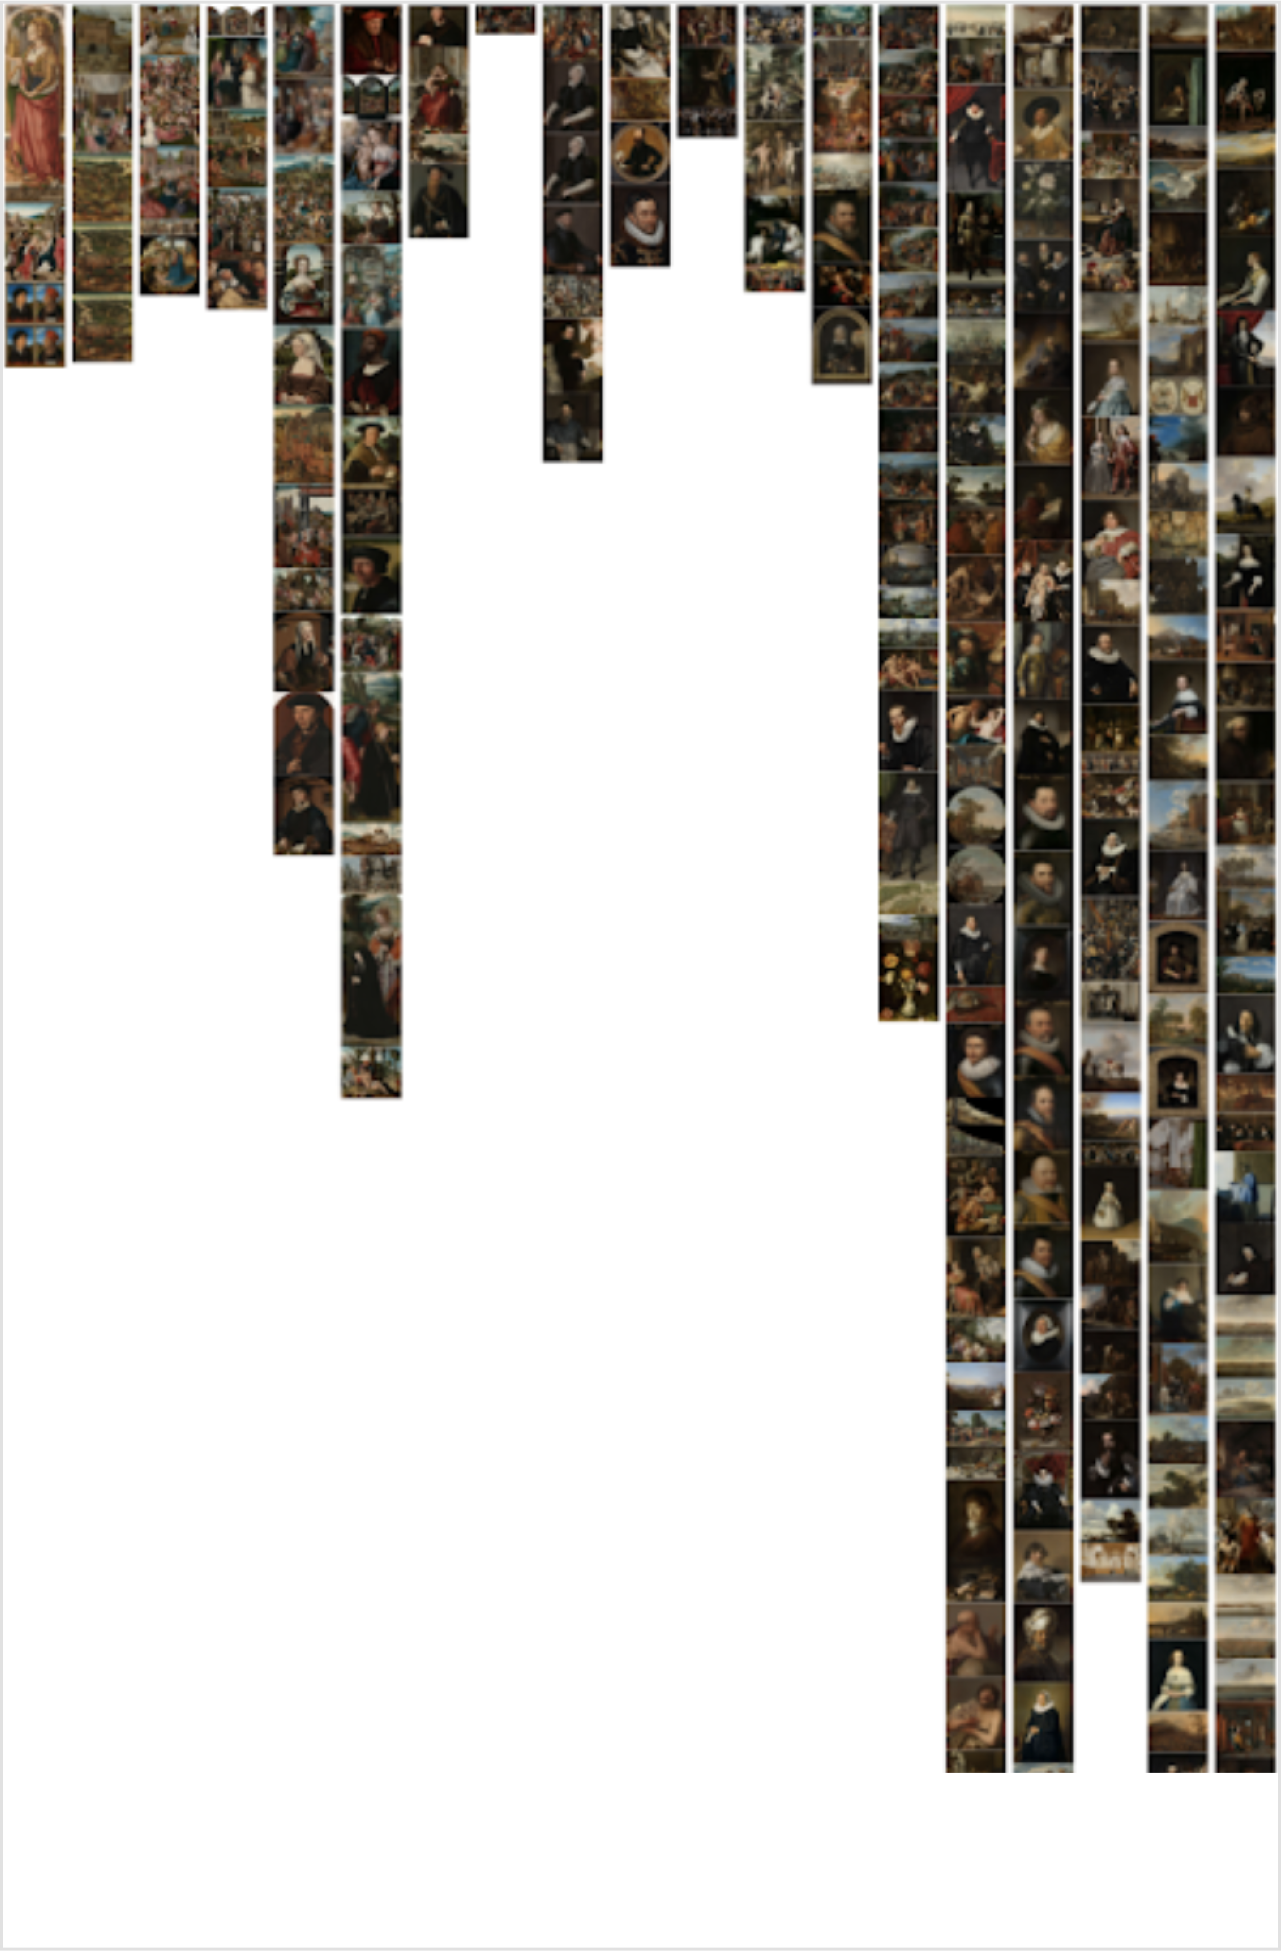
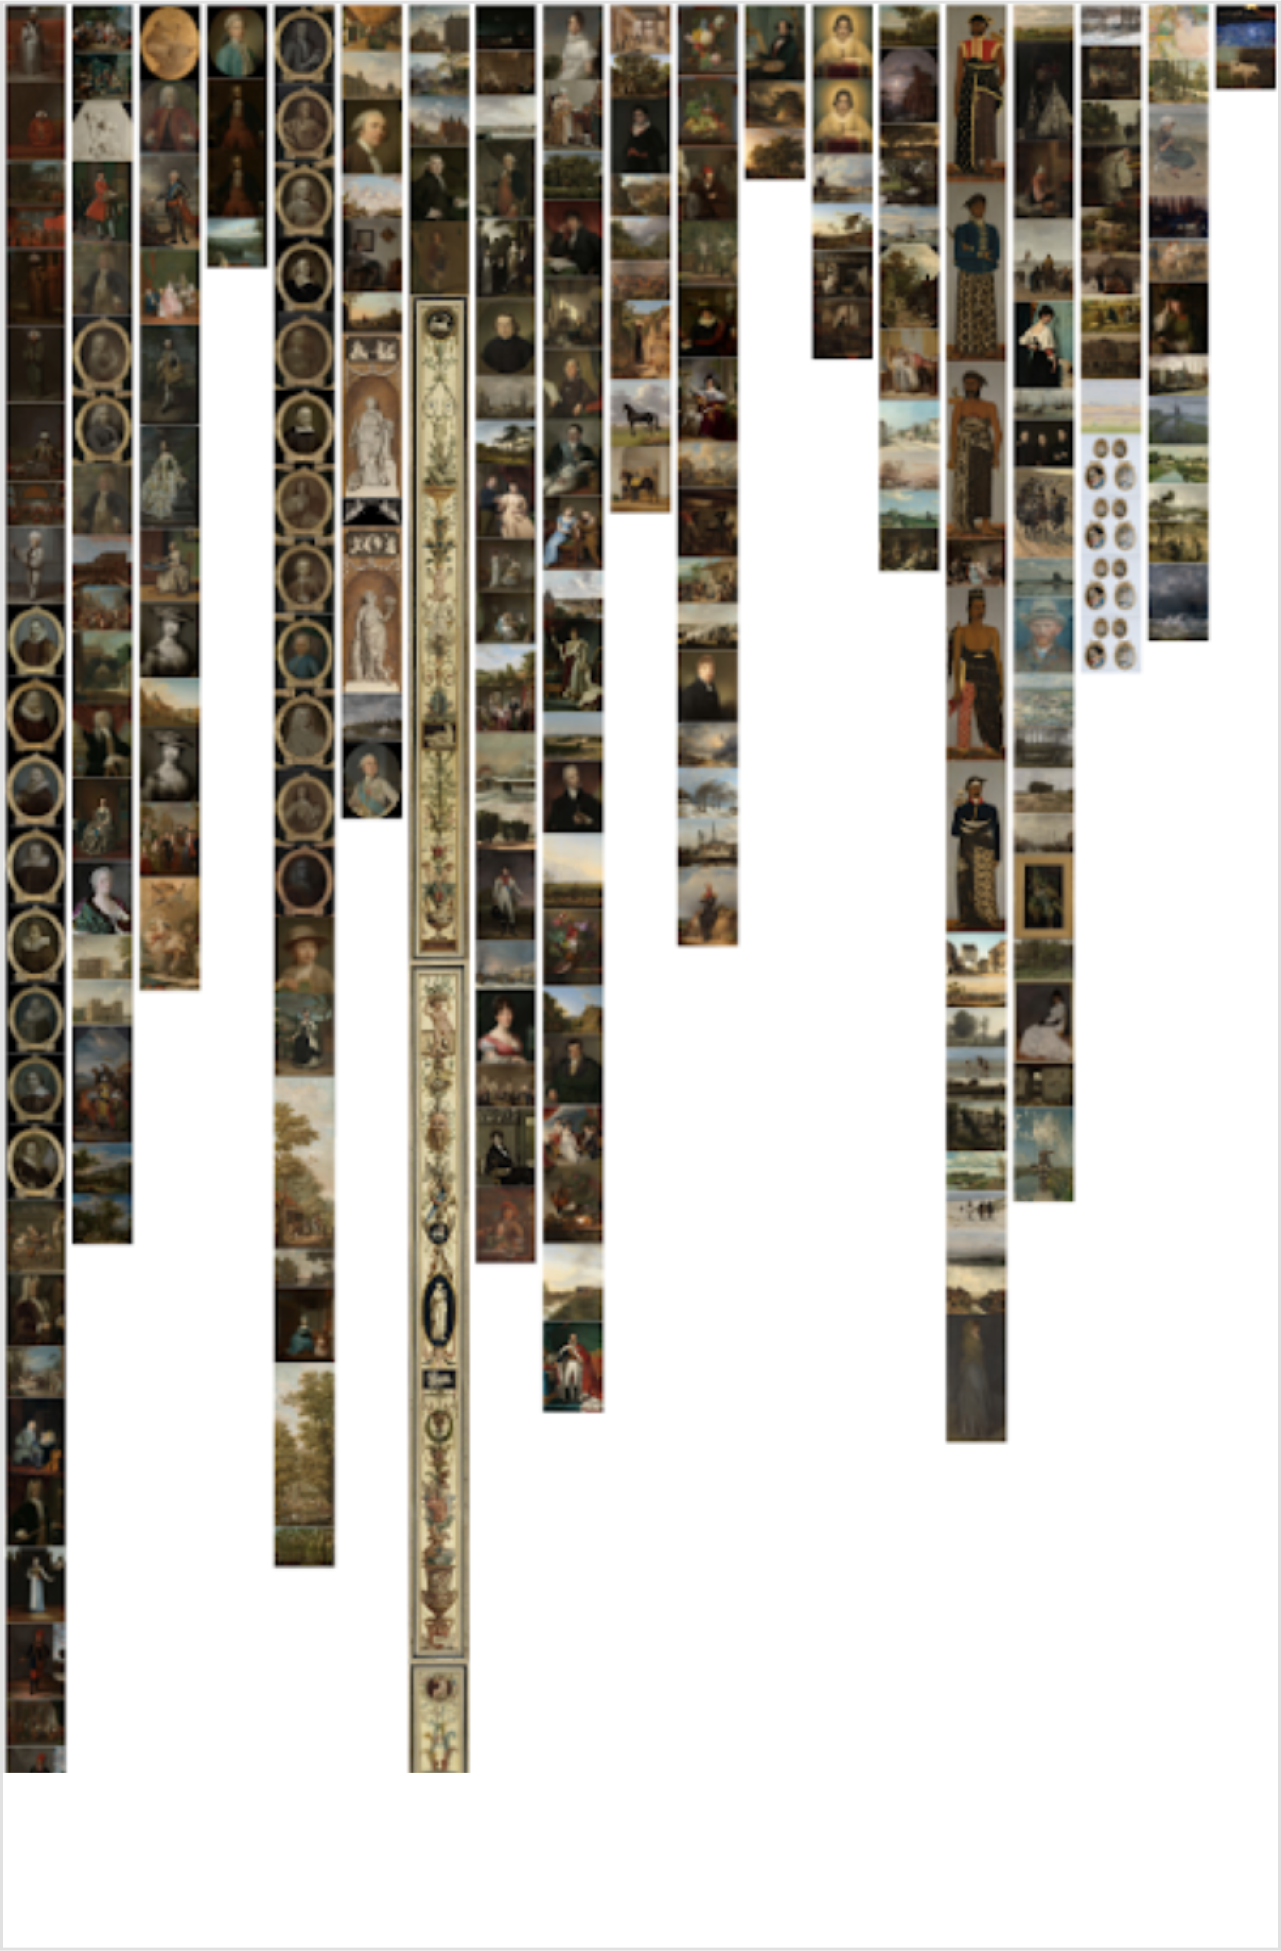
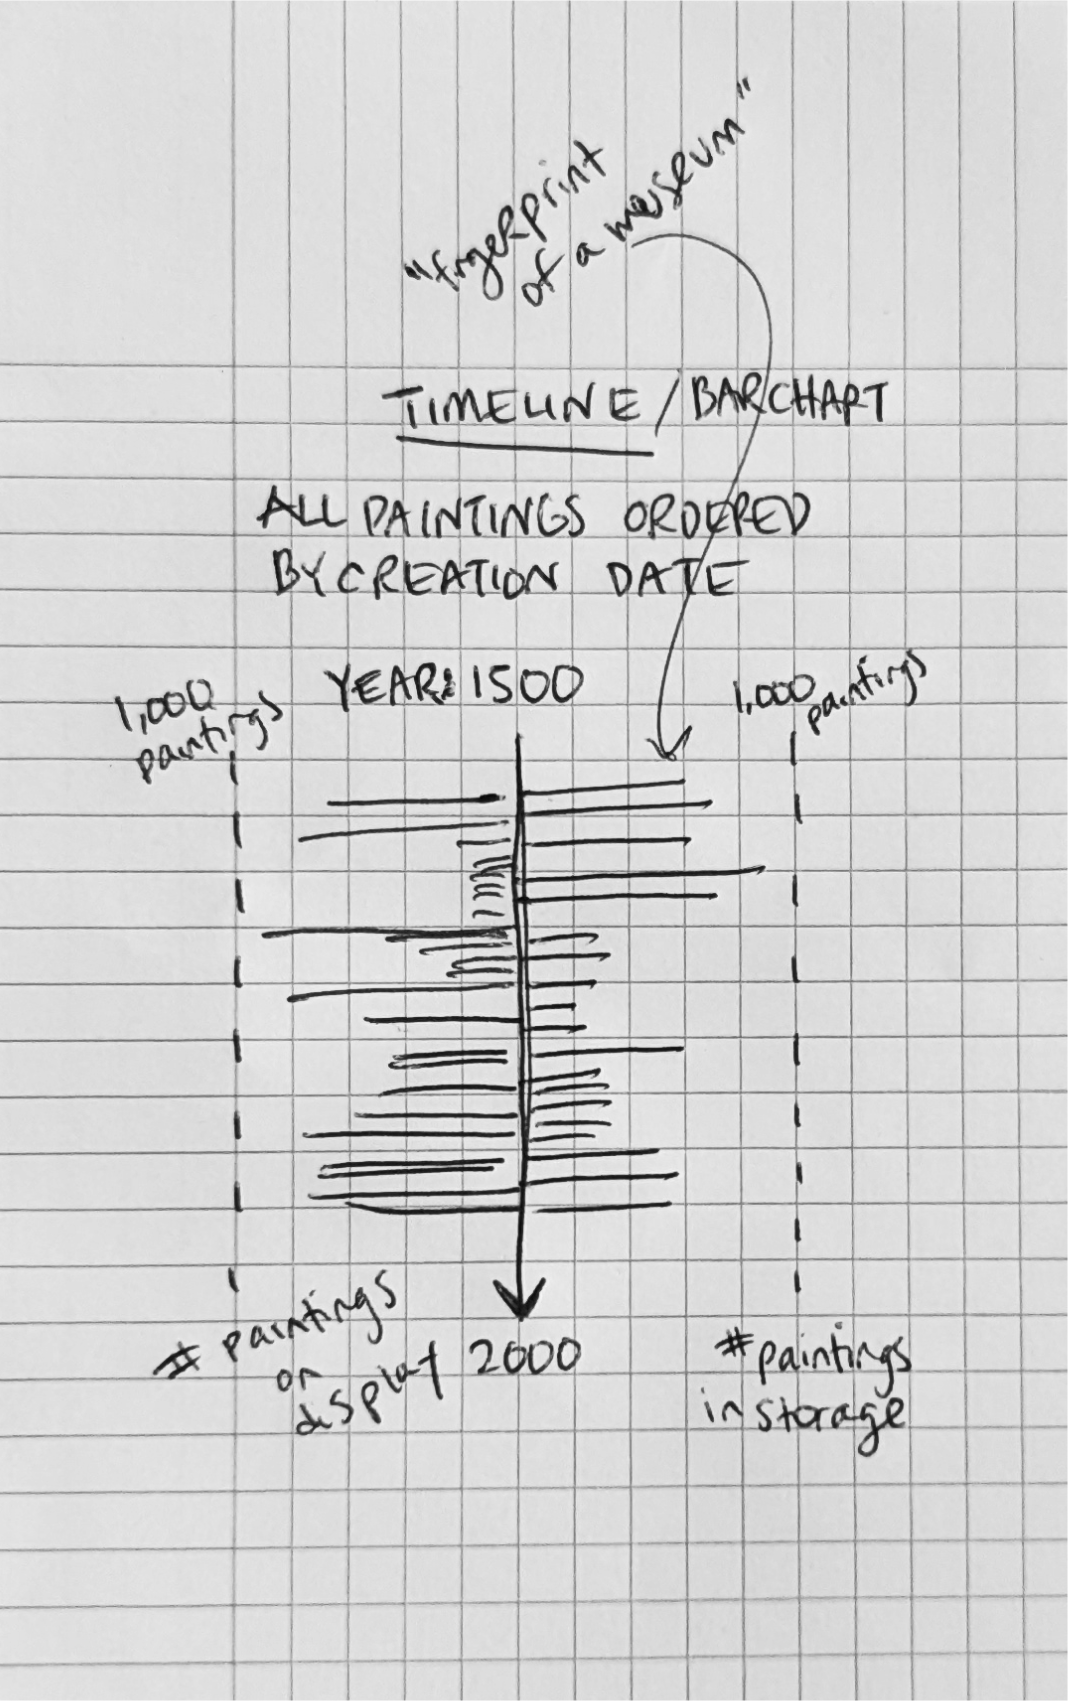
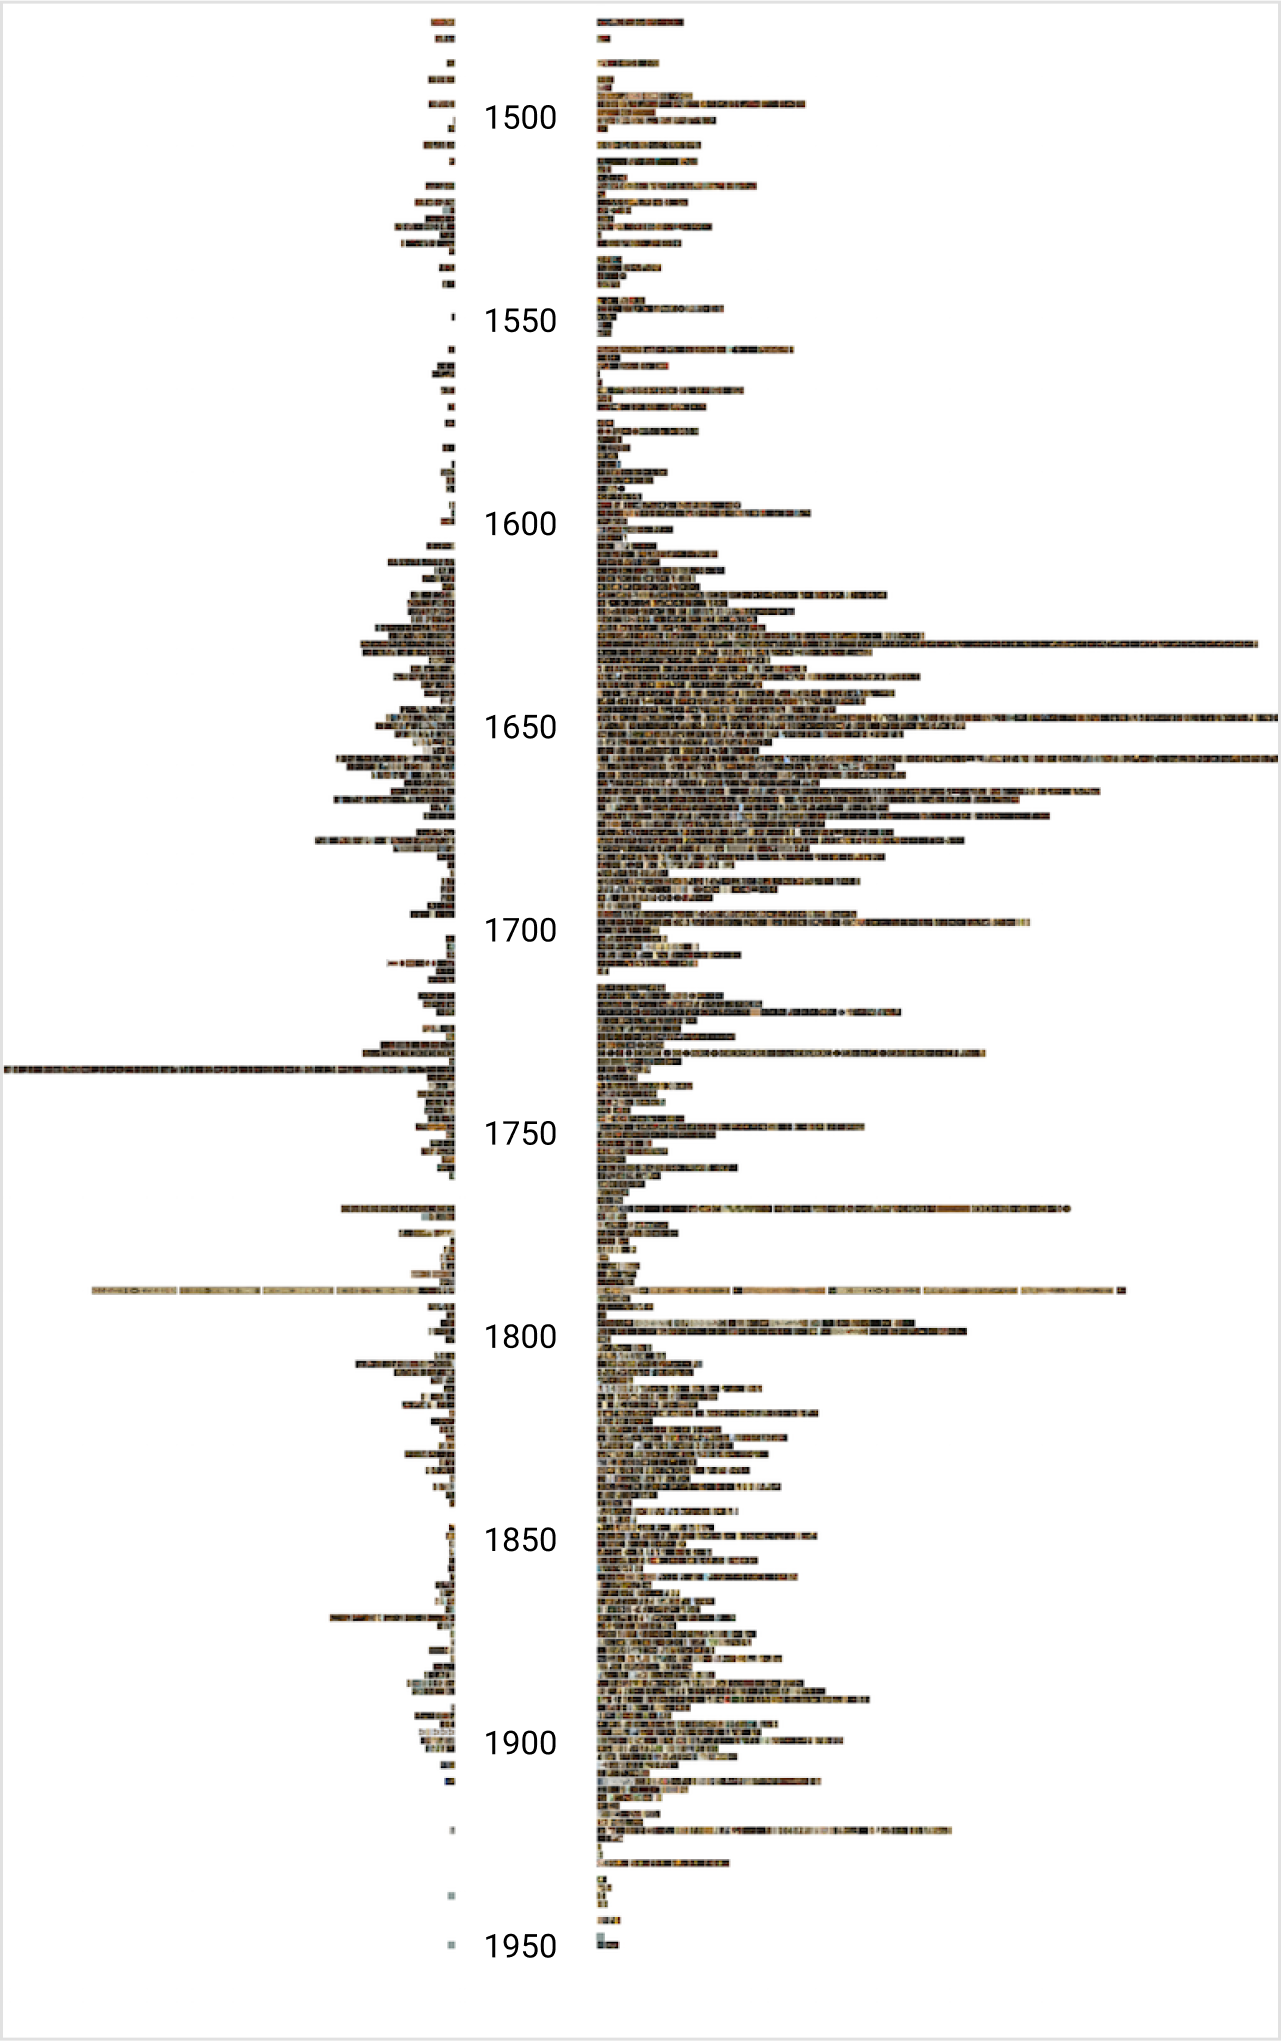
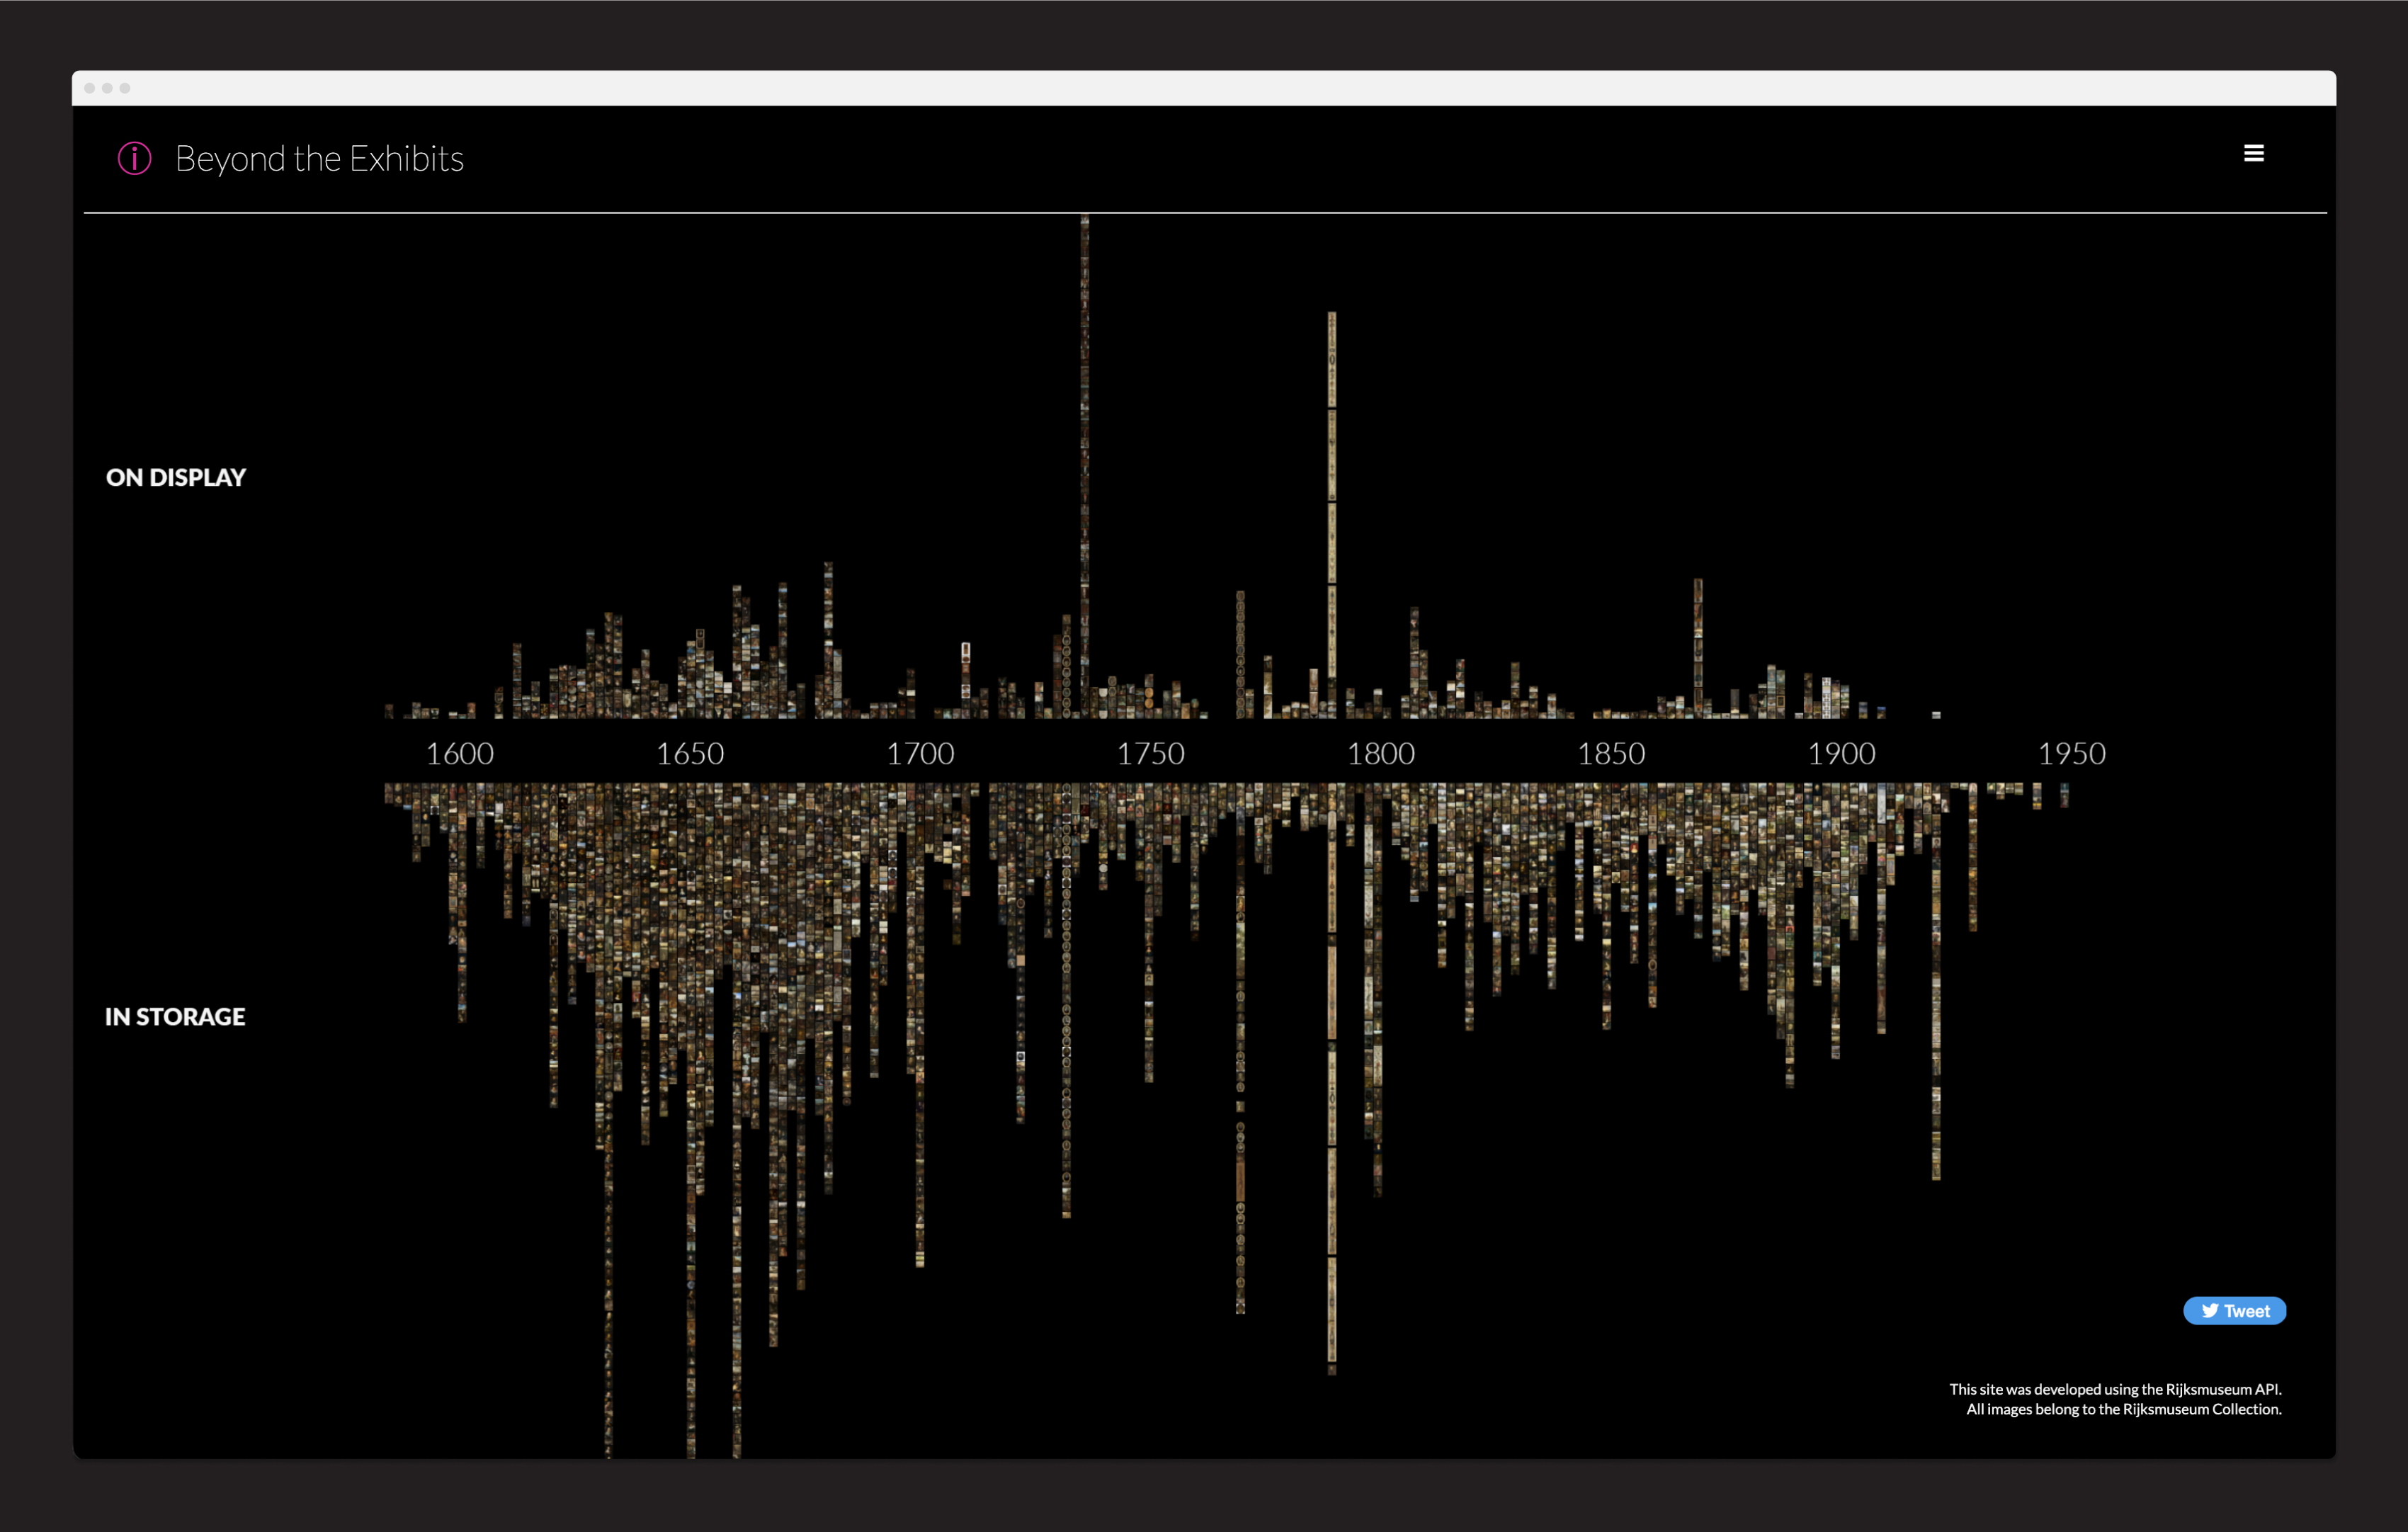
Plotting all of the 4,000 paintings on a timeline, ordered by creation date, gave a feel for the Rijksmuseum's identity. It revealed a high concentration of art spanning the 17th century, when The Netherlands experienced The Dutch Golden Age. At this time, Dutch trade, science, military, and art were among the most acclaimed in the world. The period during The Hague School (1860-1890) had denser coverage, too. We also highlighted if a painting was currently on display or in storage. This “exhibit,” a simple graph, illustrates that visiting a museum can just scratch the surface of its full collection.
Exhibit II
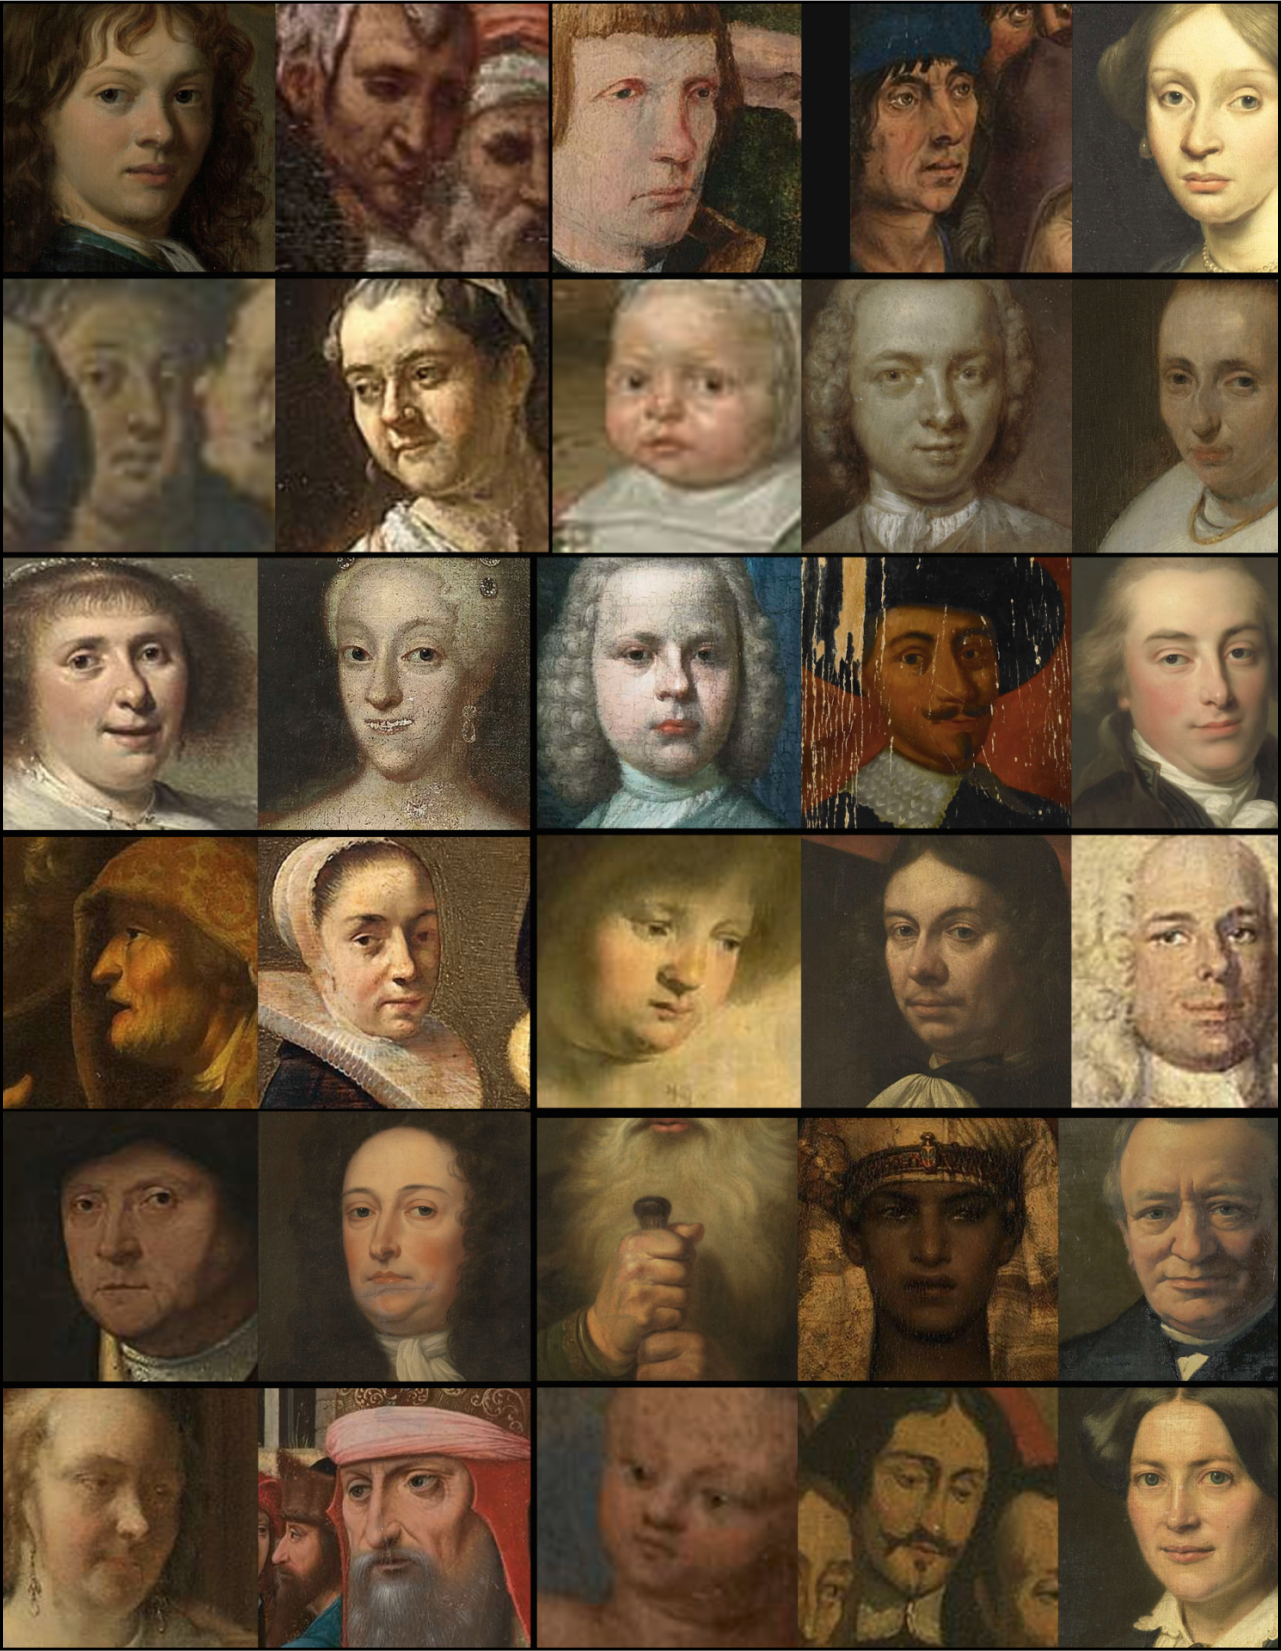
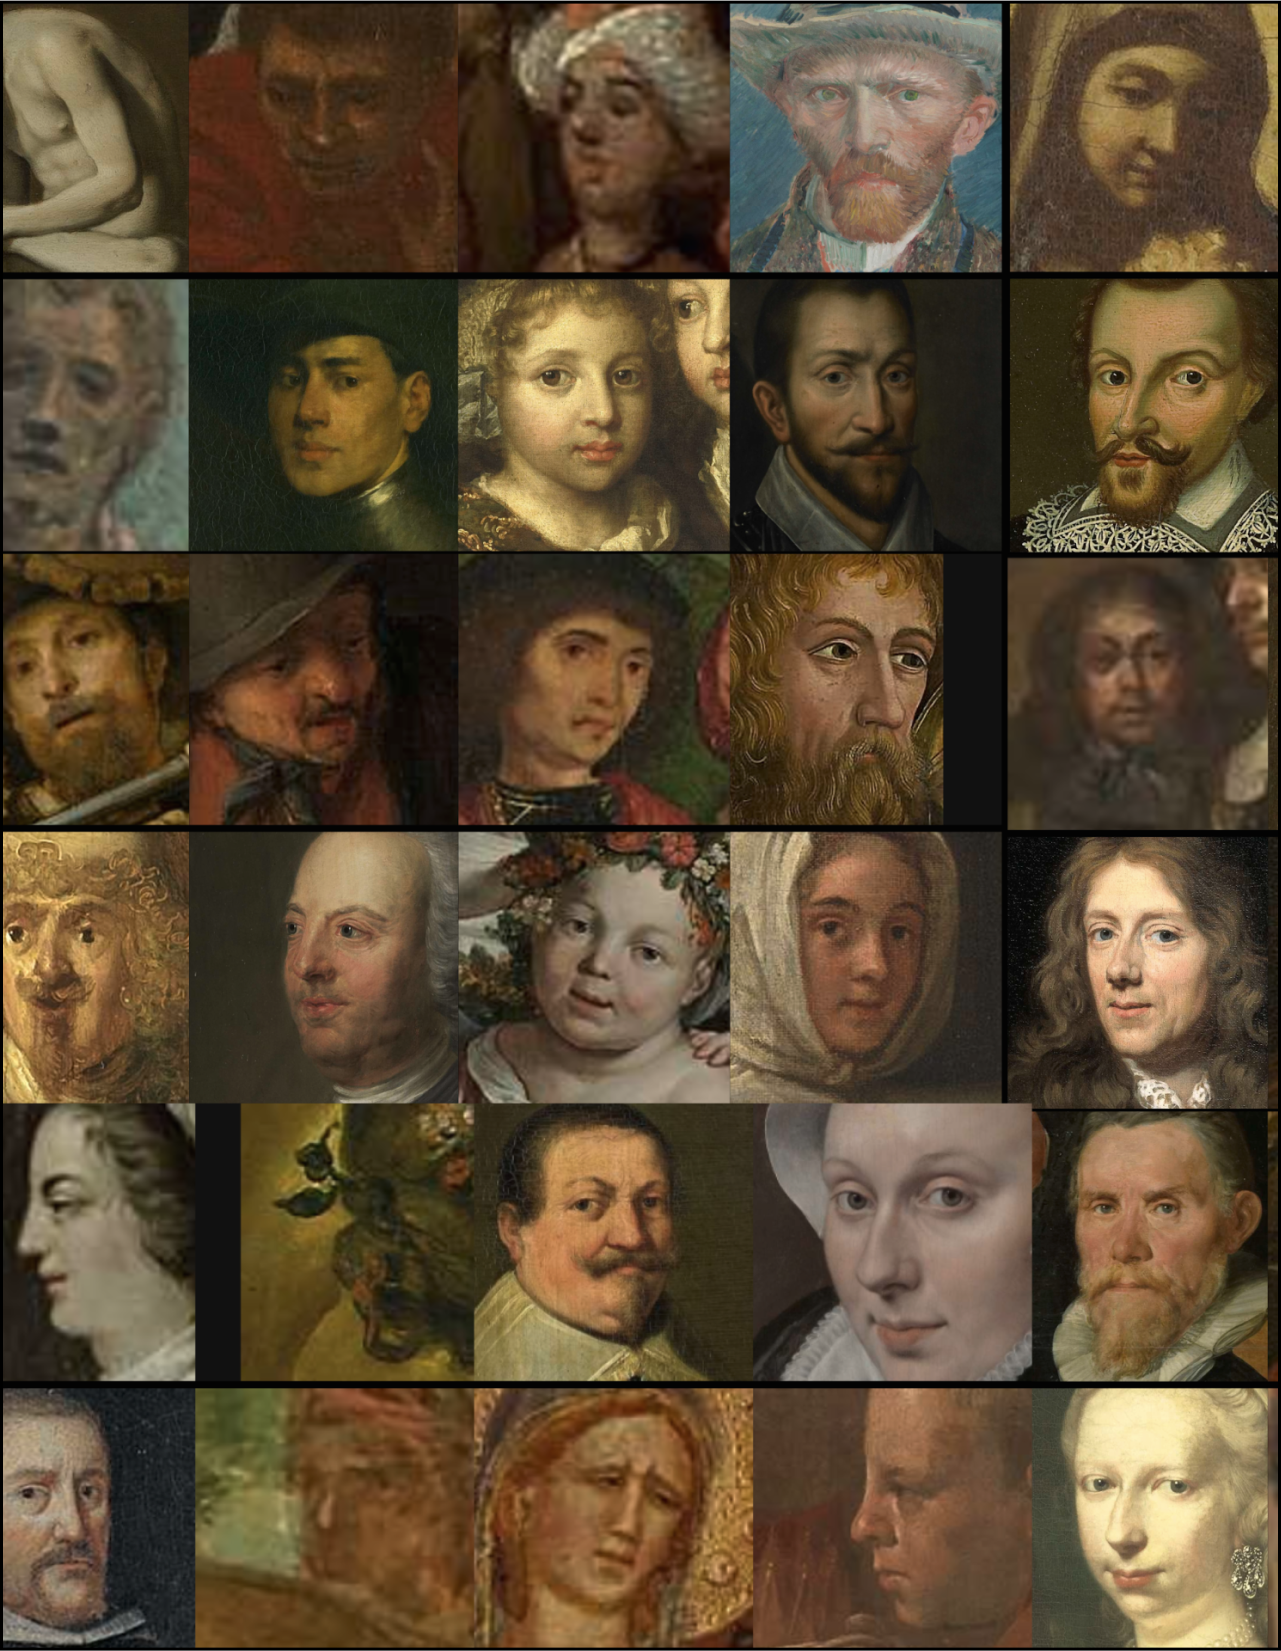
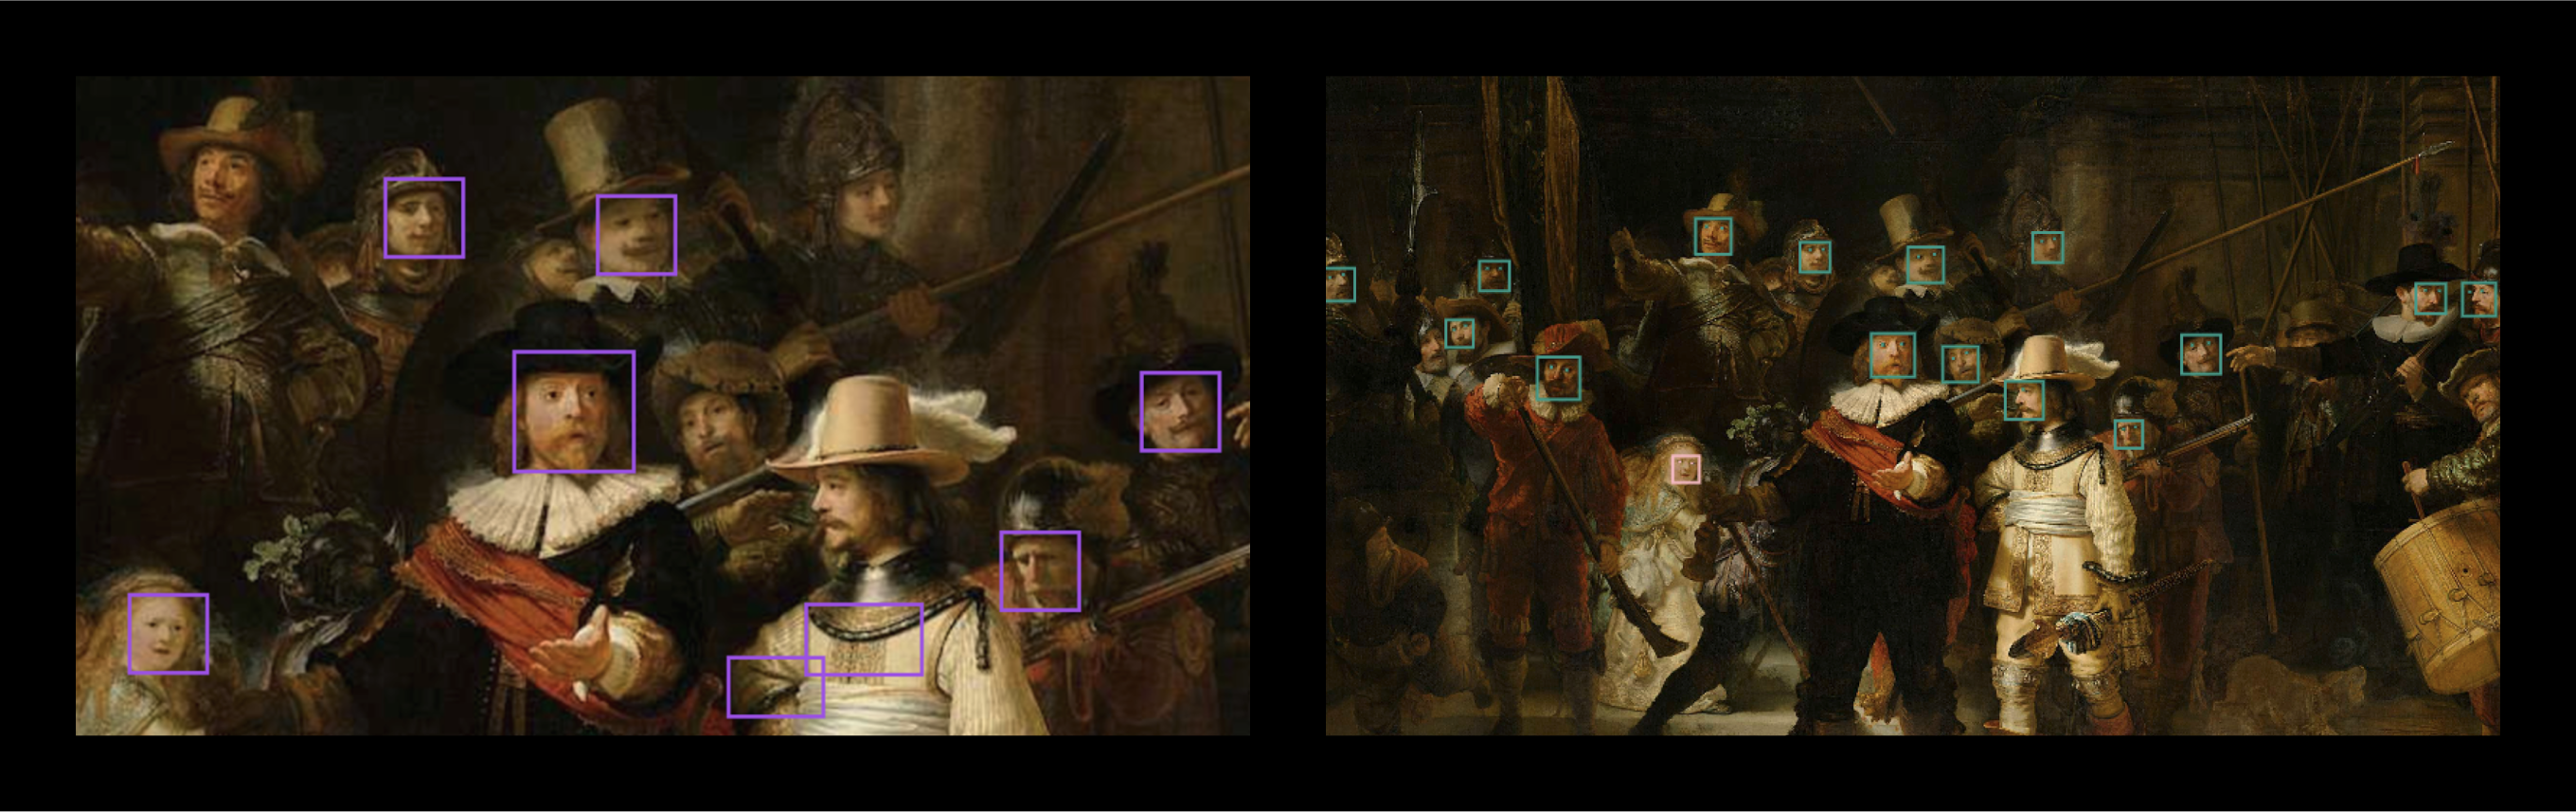
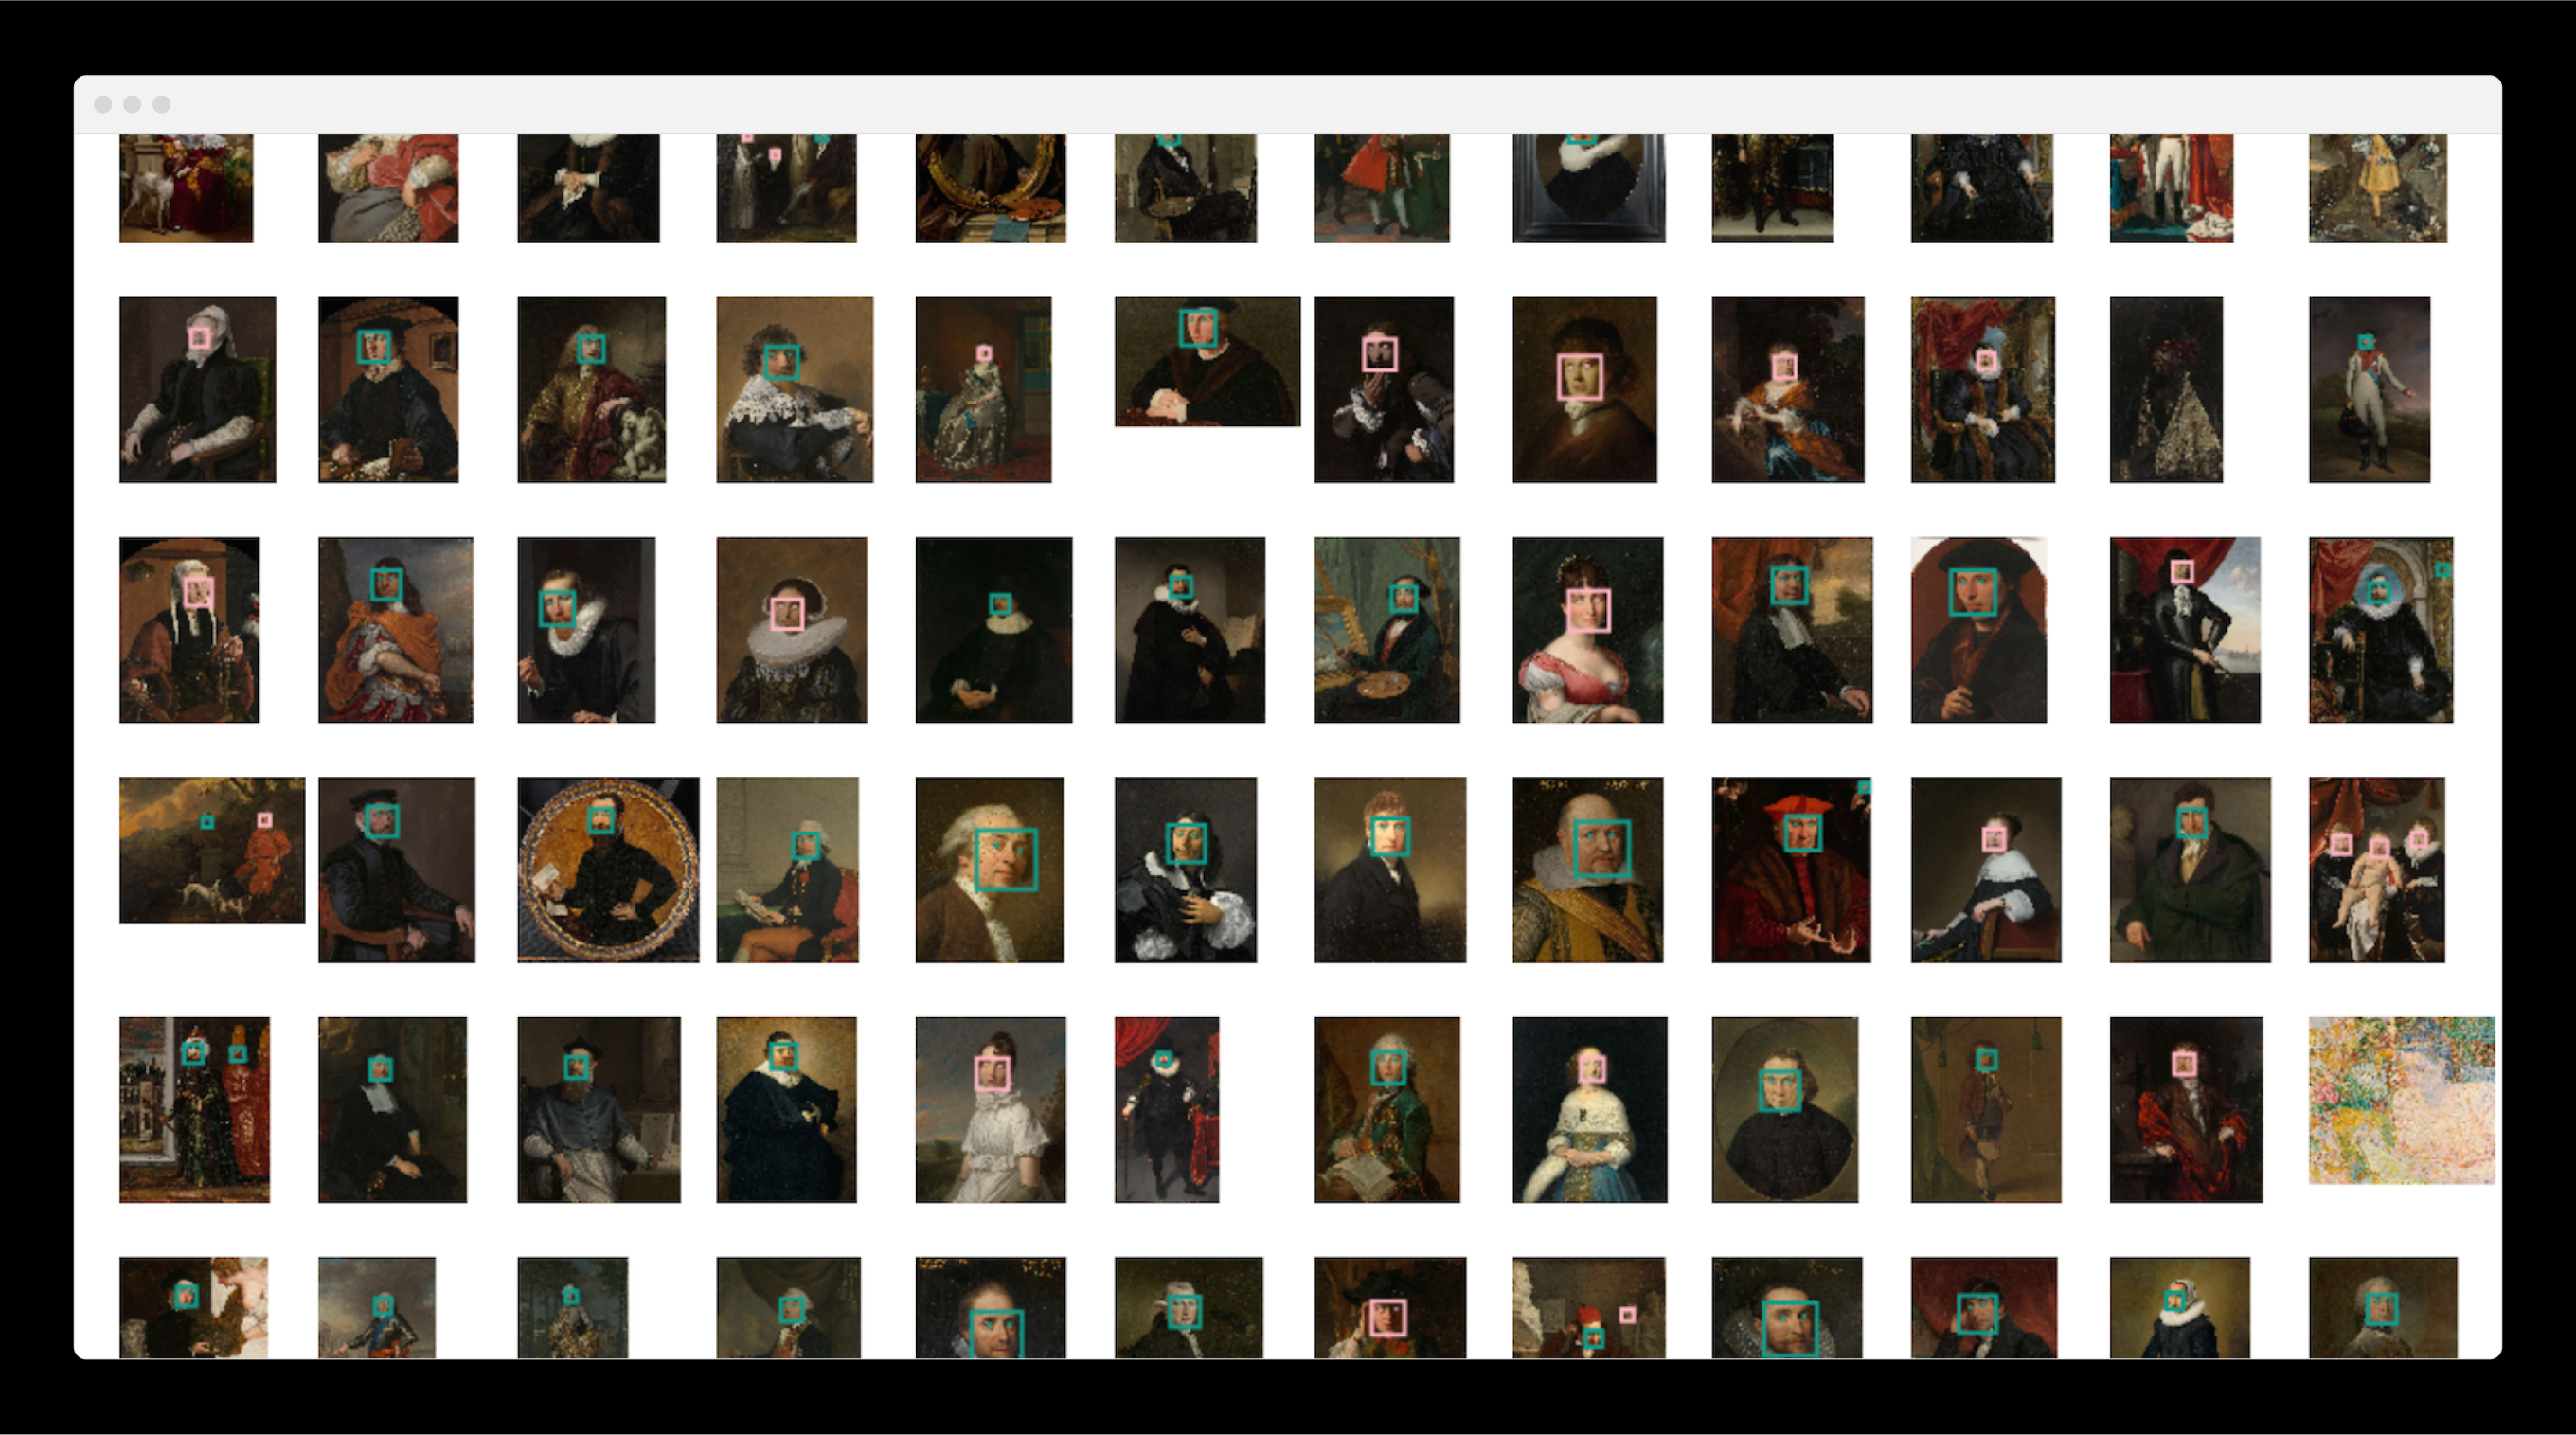
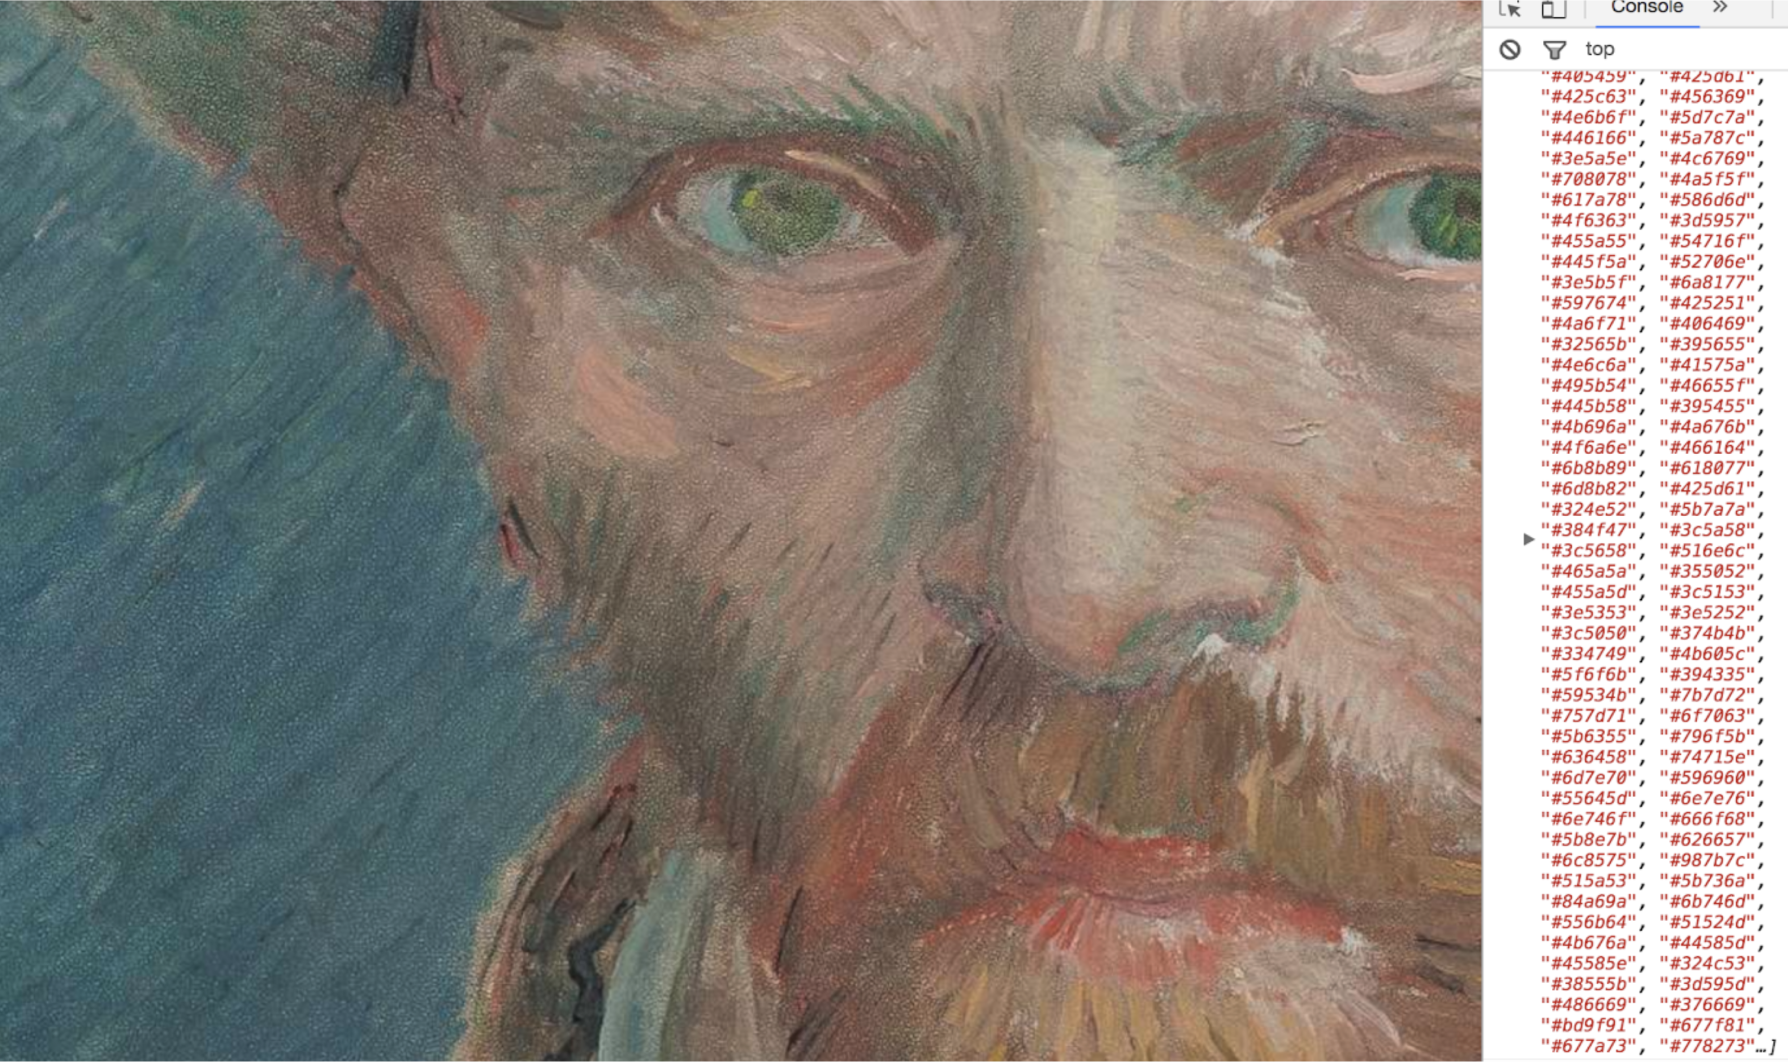
Next, we explored new, delightful ways for users to traverse a collection. Why not through the characters featured in the paintings? Using the format established by social media, this amusing “exhibit” granted users the ability to engage through a web of personalities. We ran facial recognition APIs on the paintings, testing a few options before landing on an option: Kairos. It also estimated other characteristics, which we hoped would playfully augment the dataset further.
Exhibit III
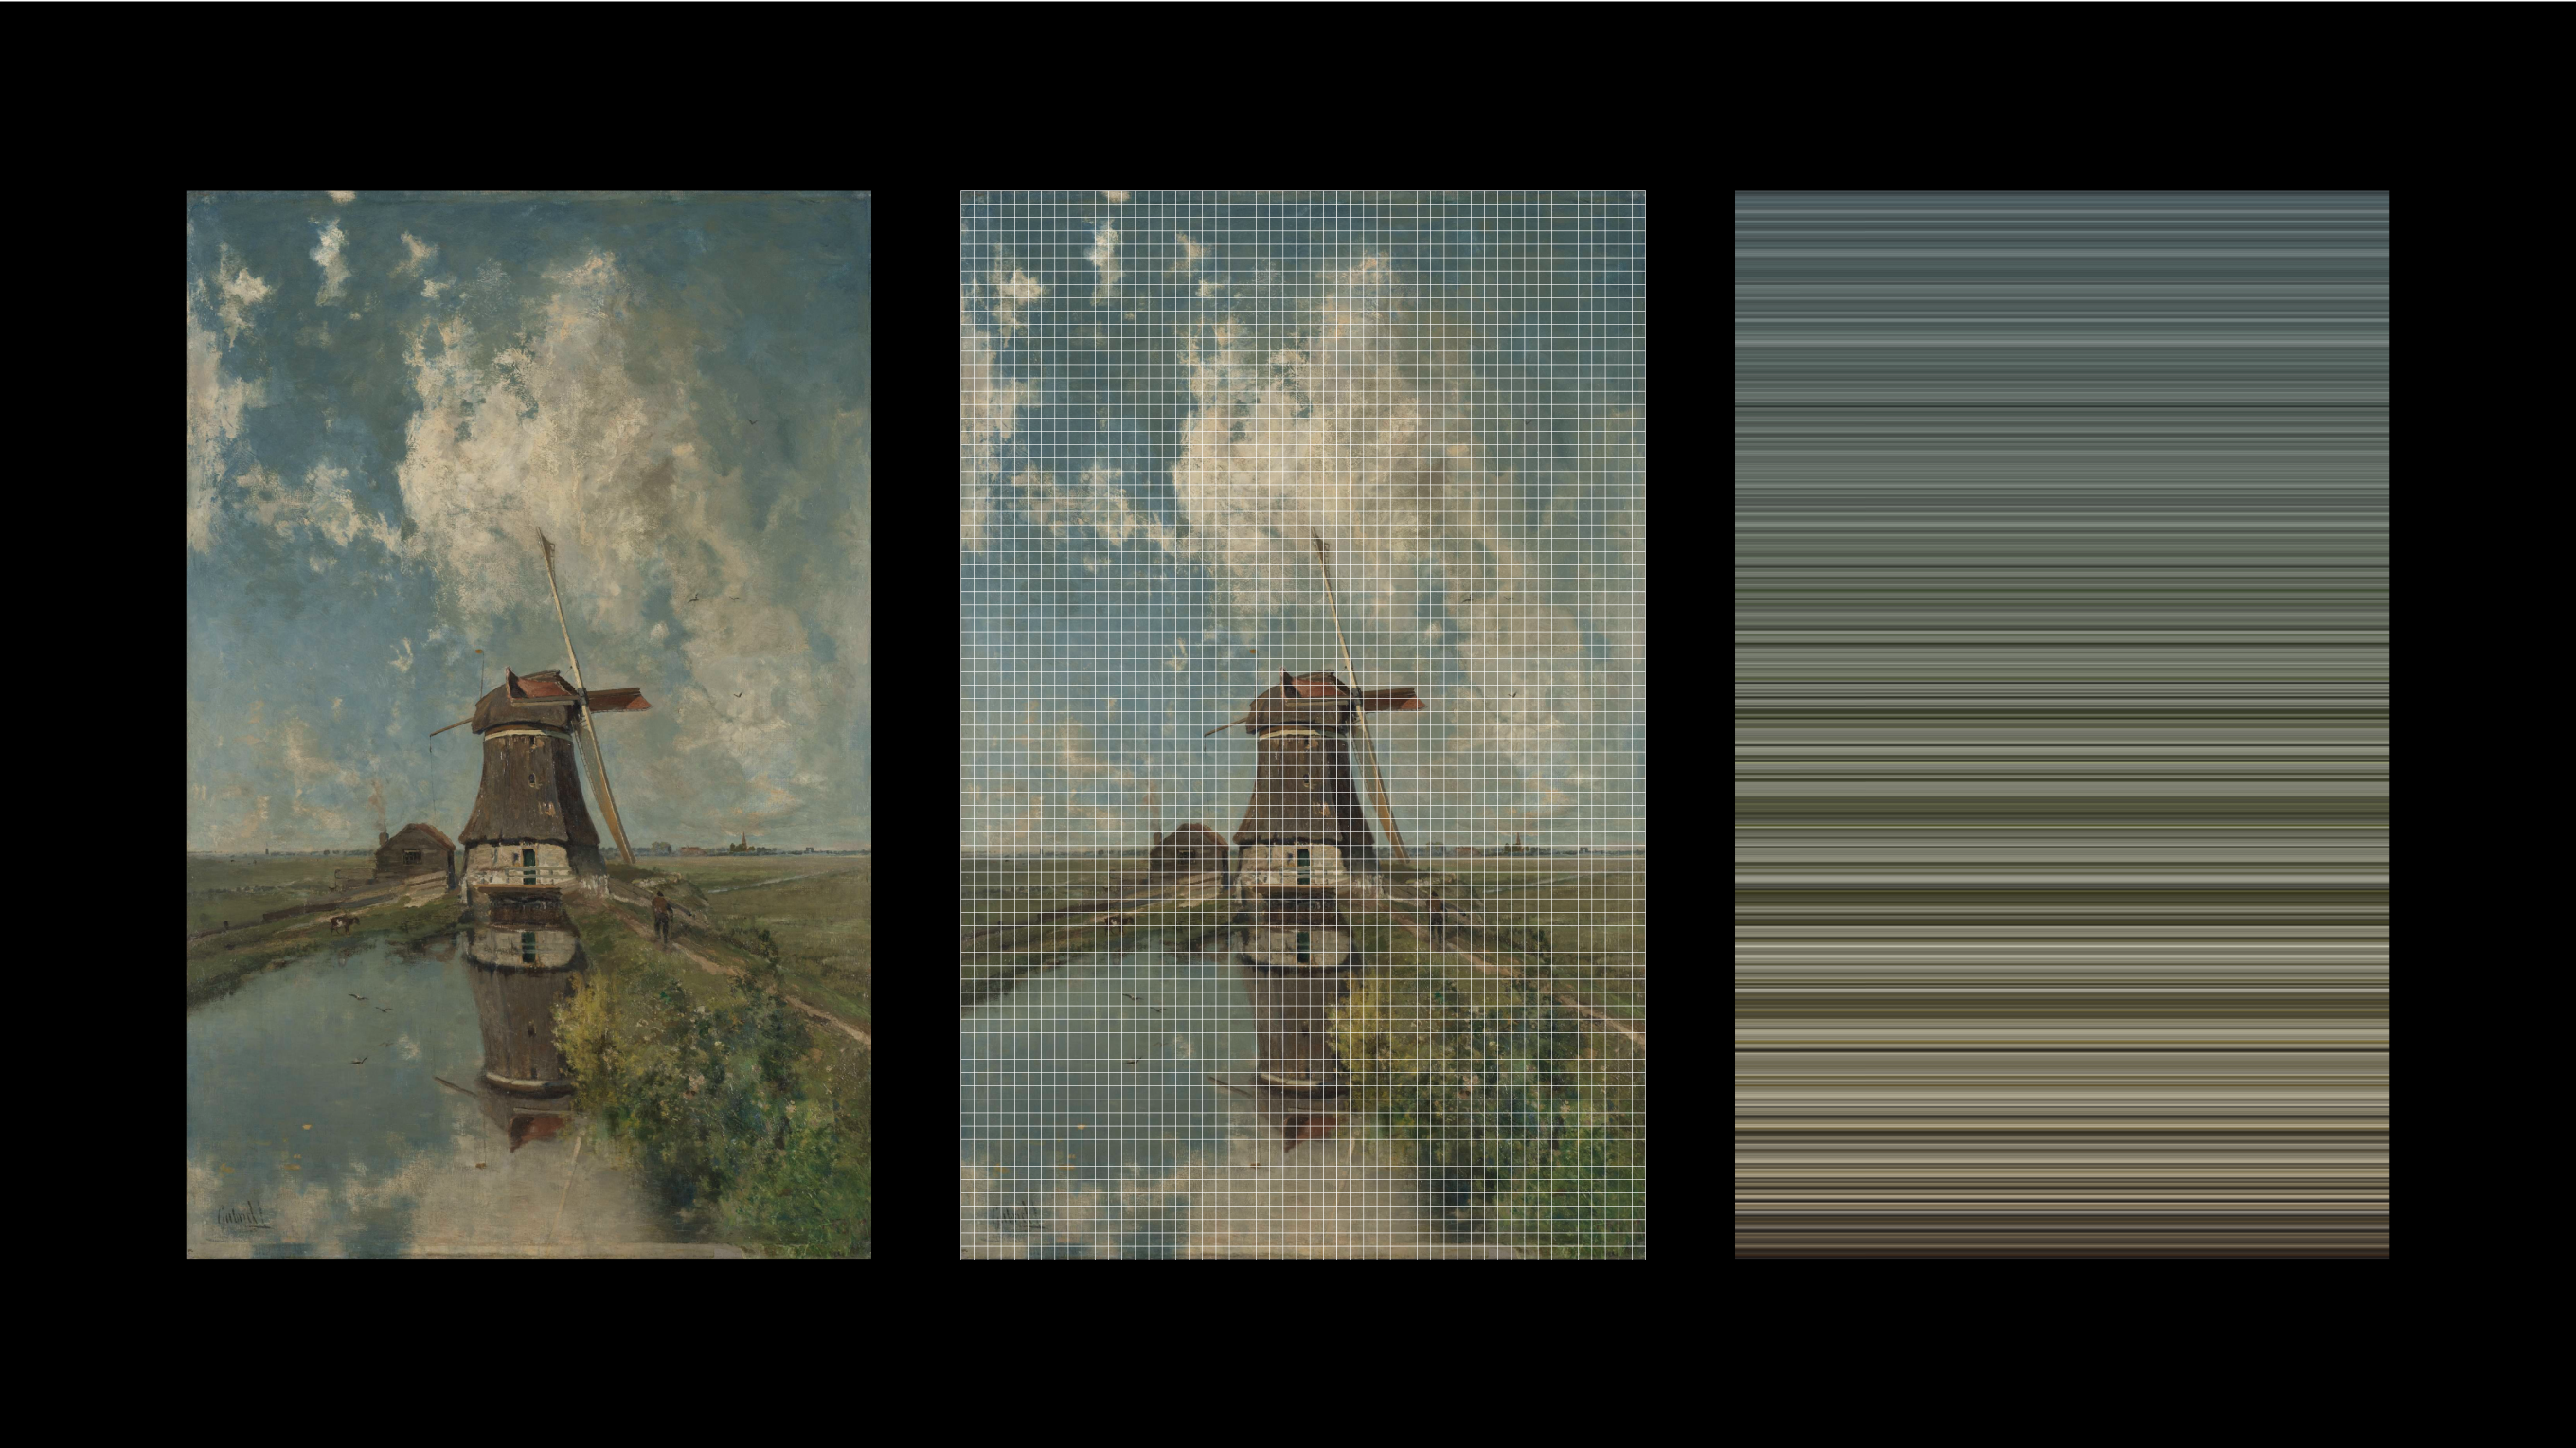
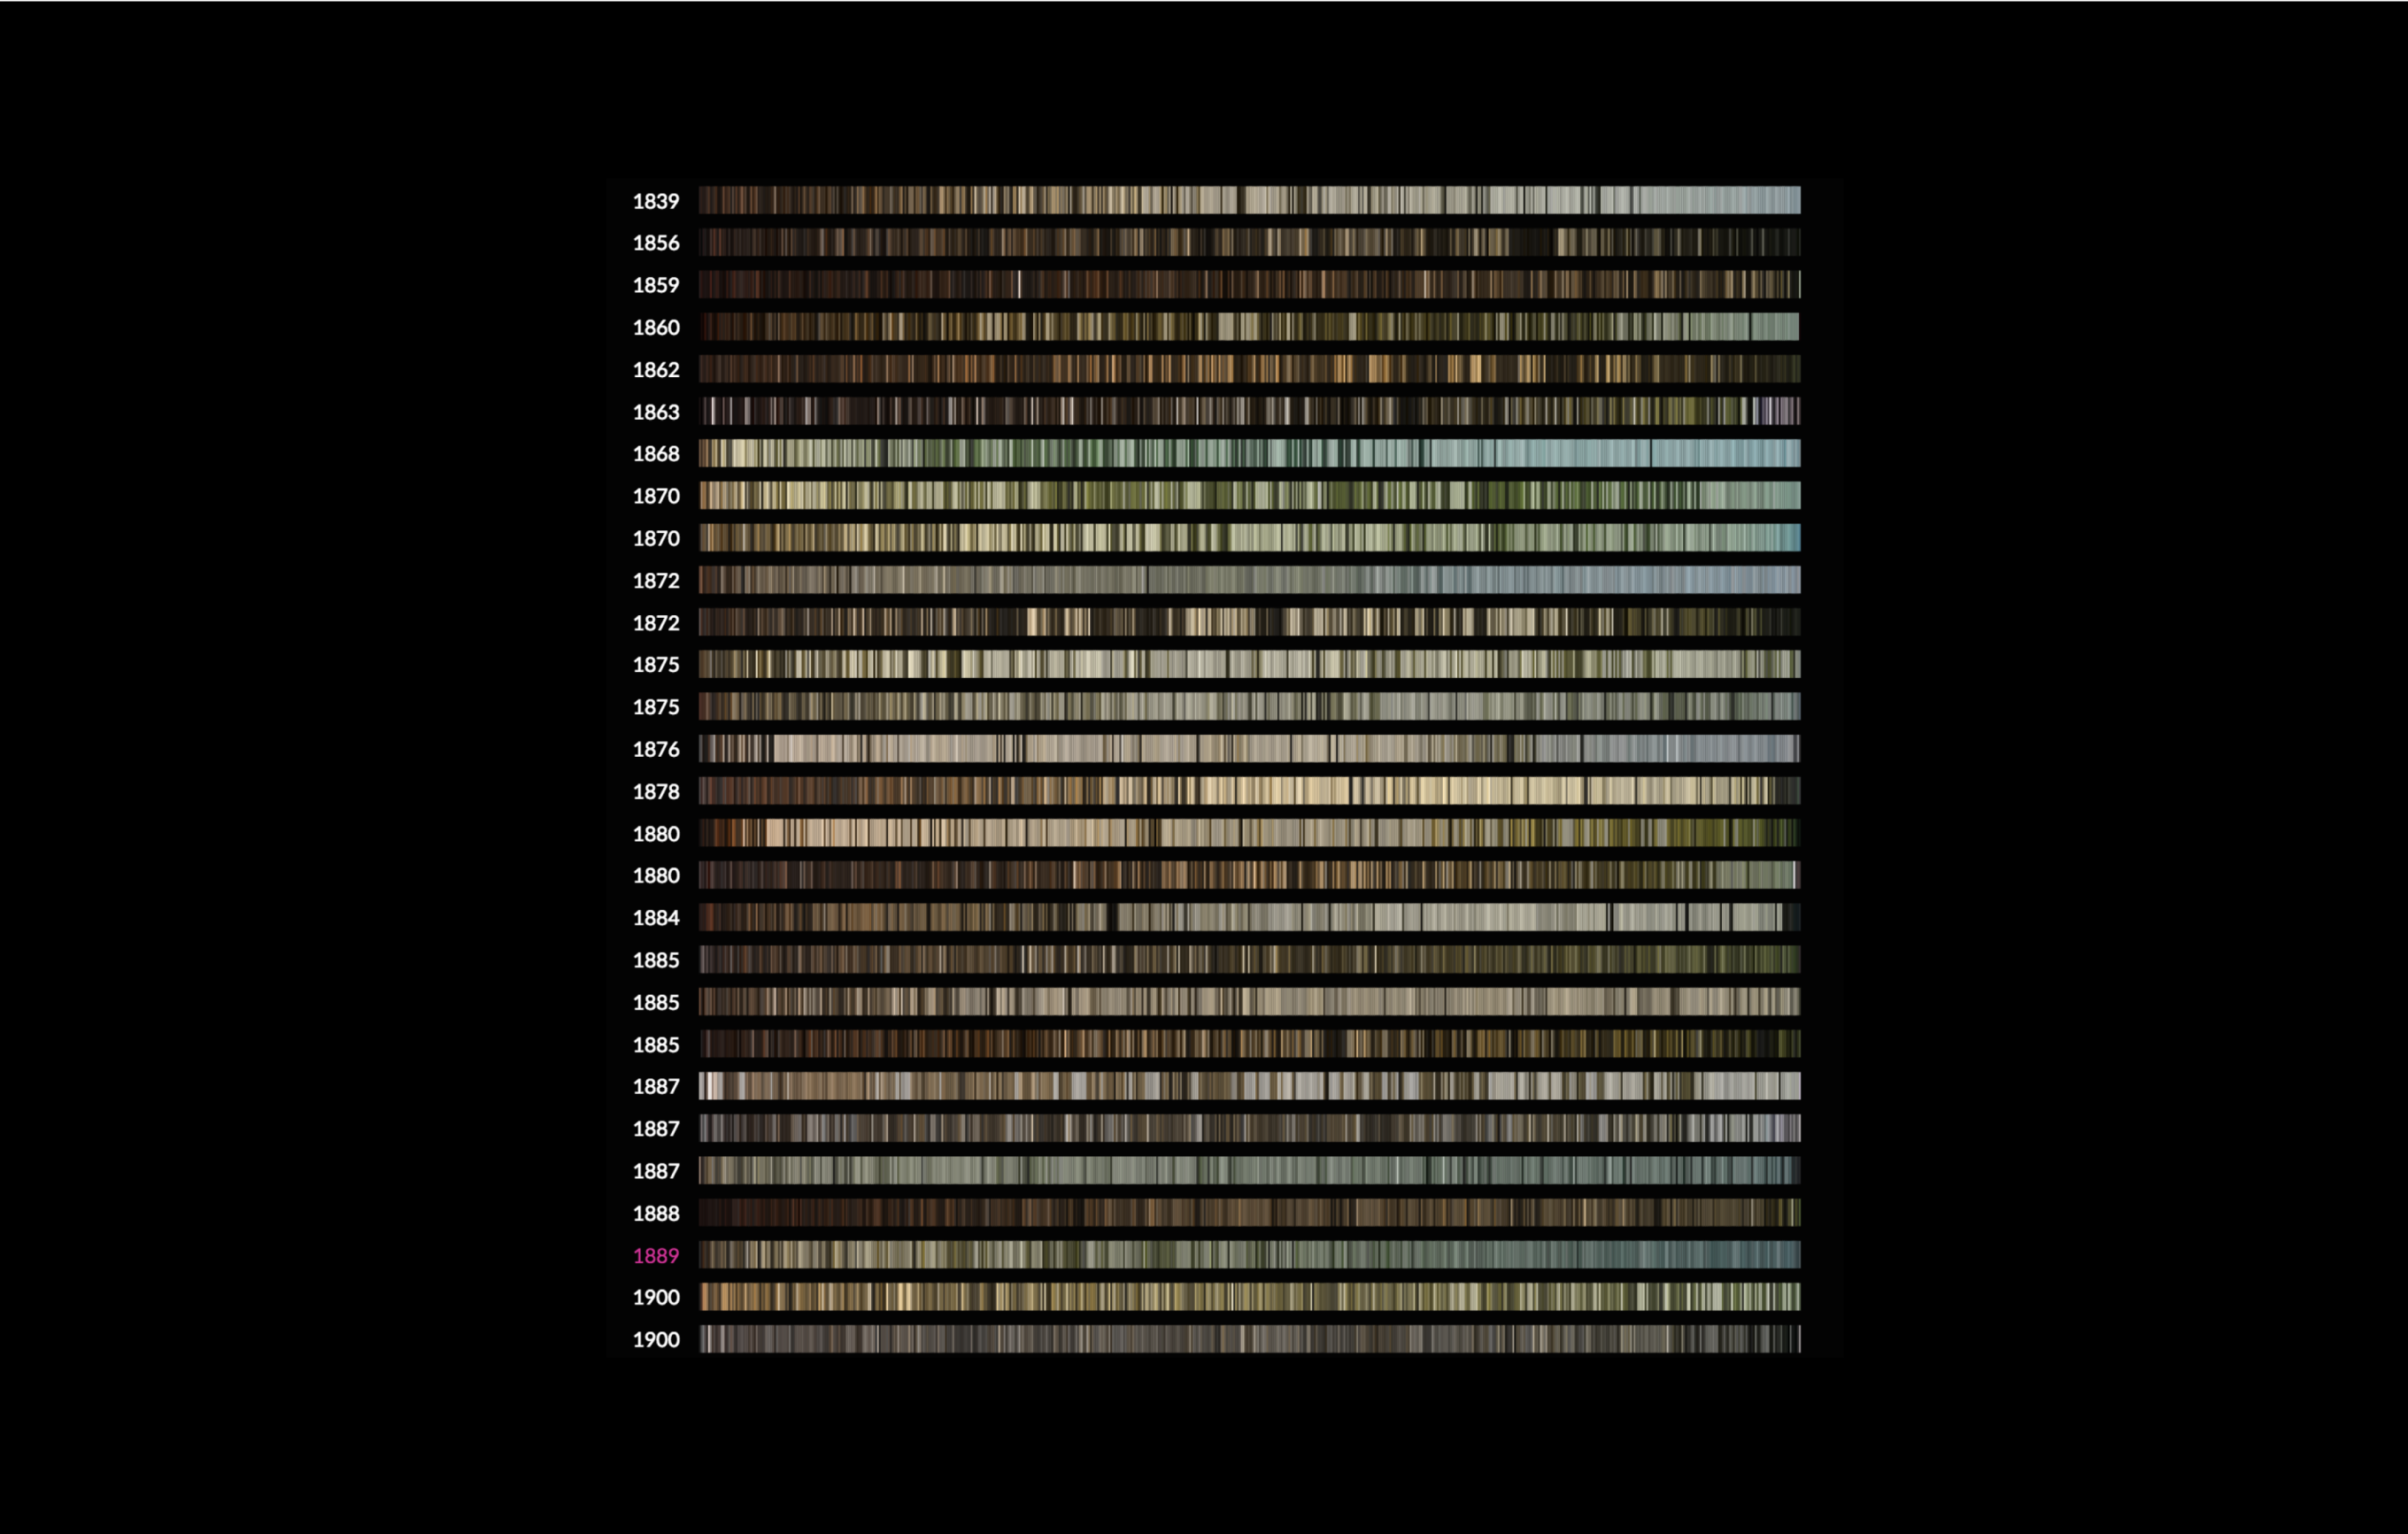
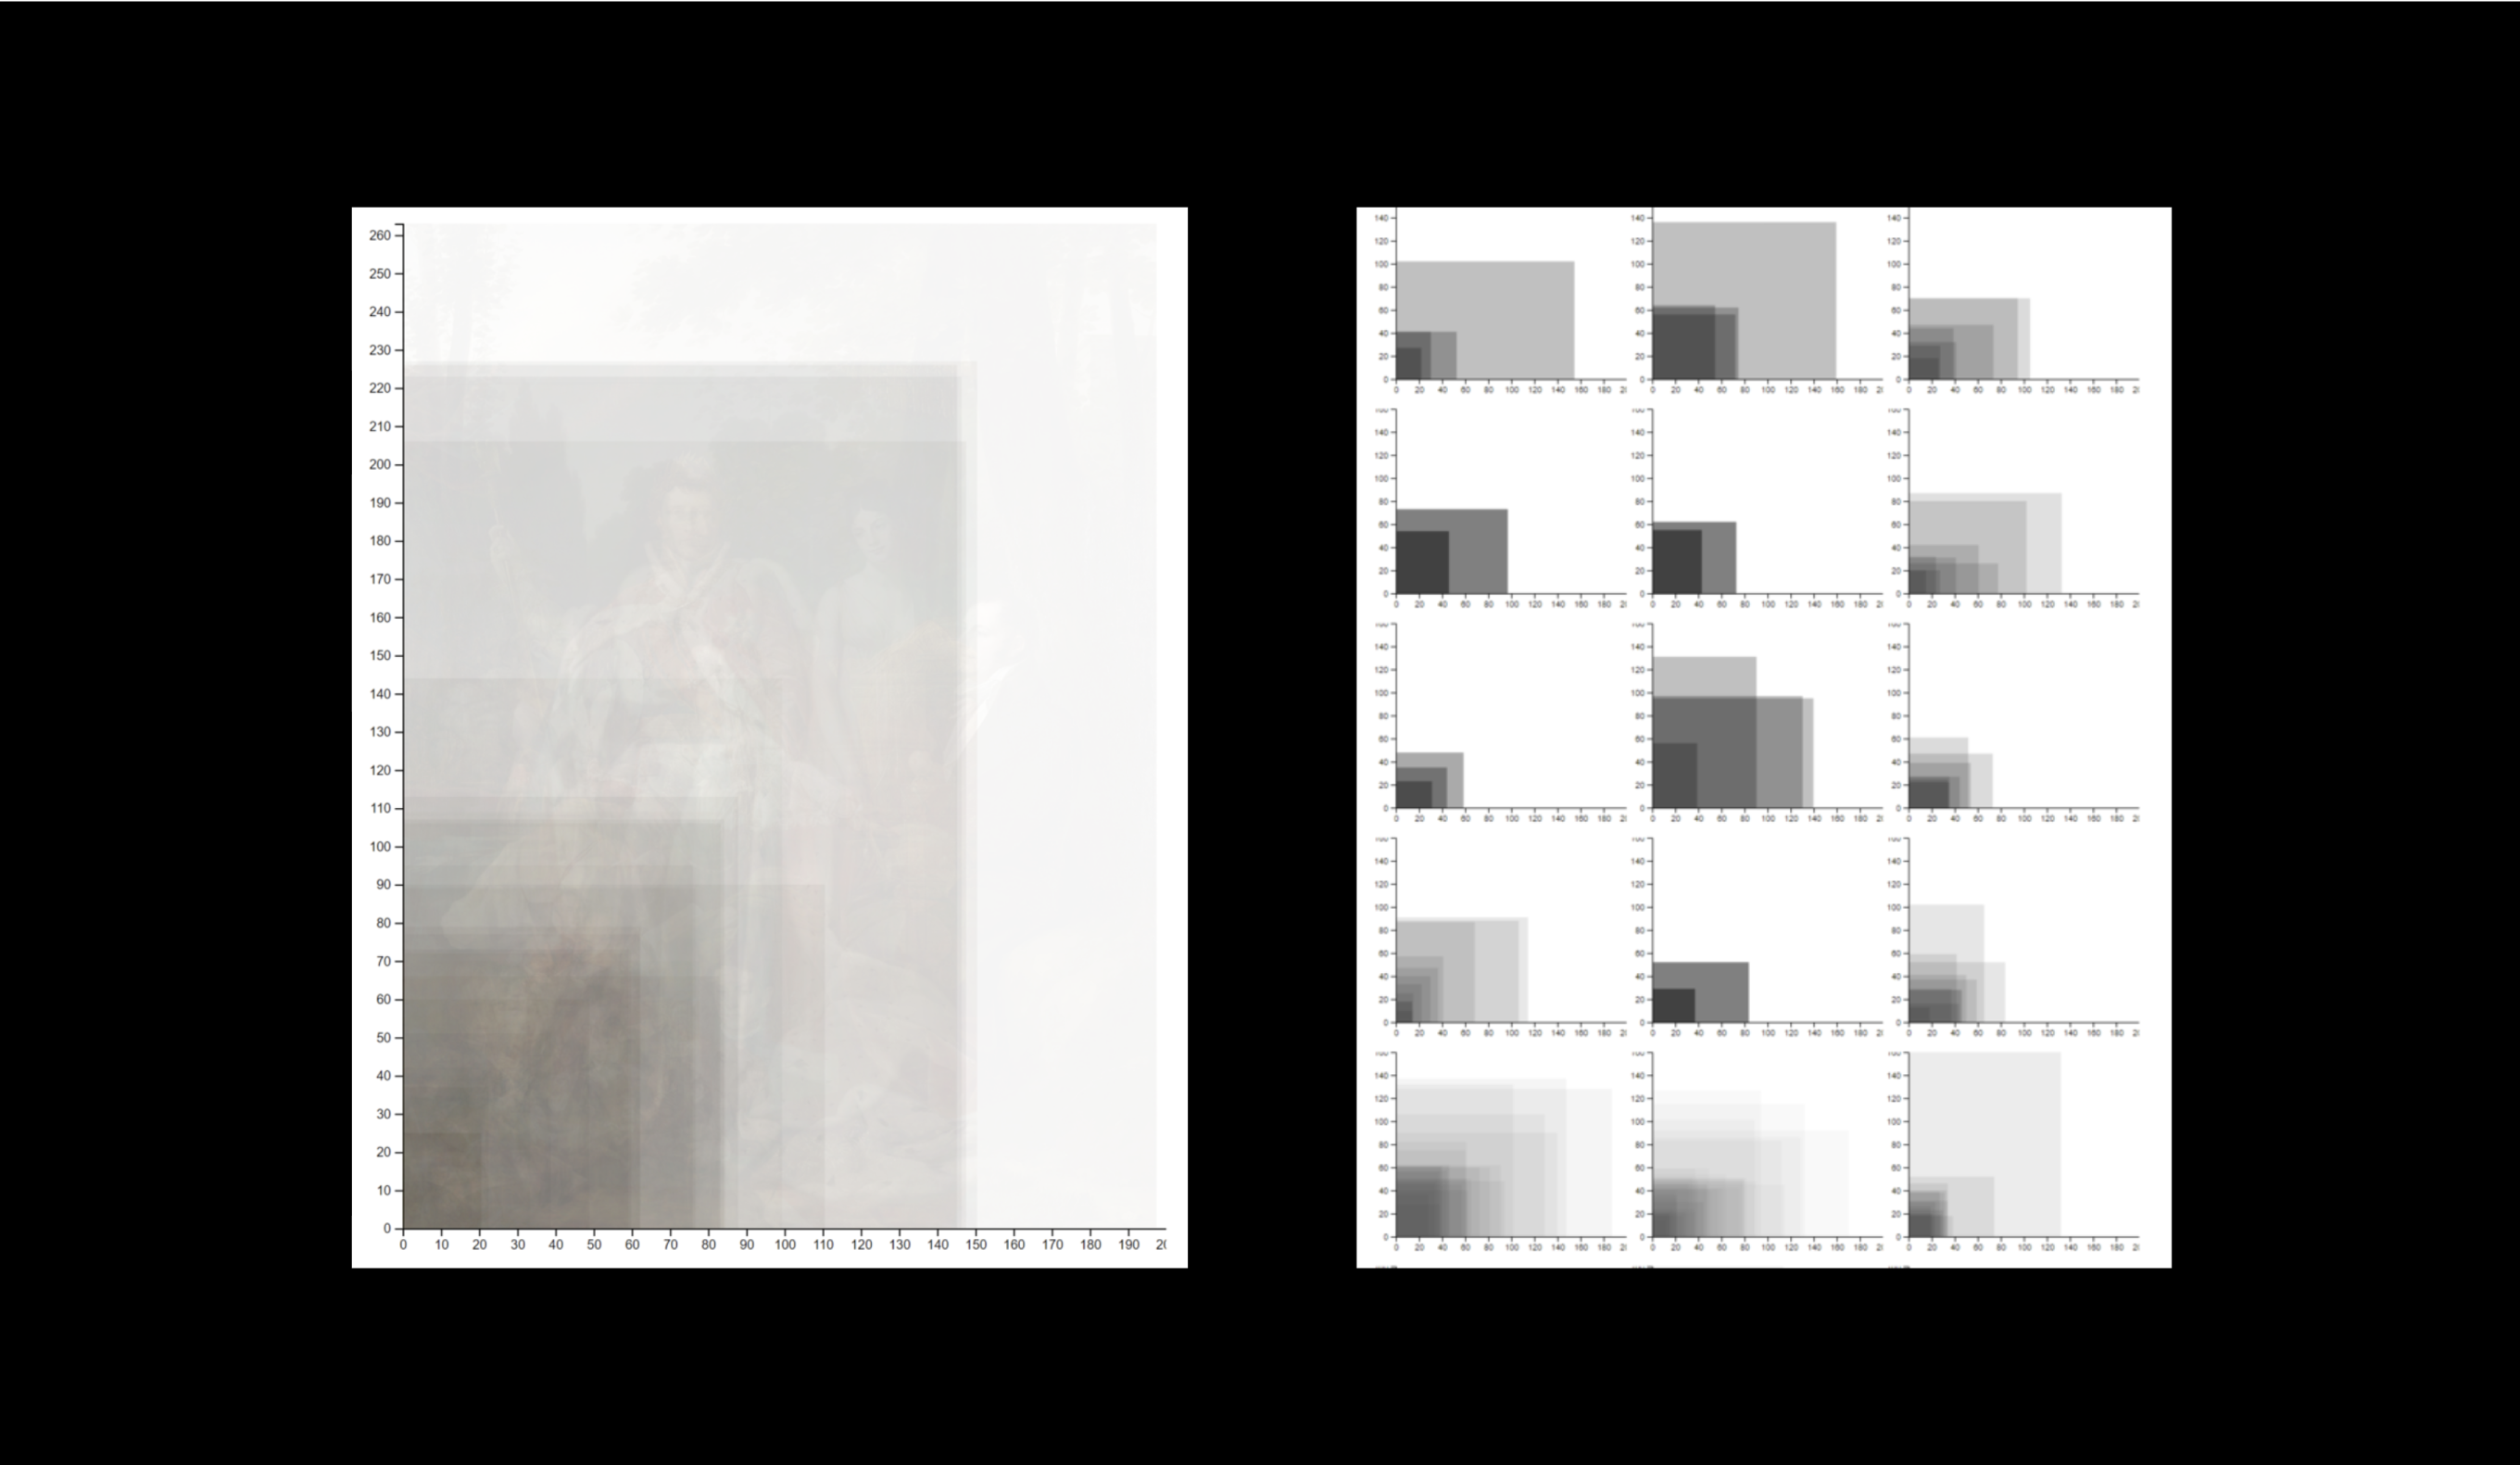
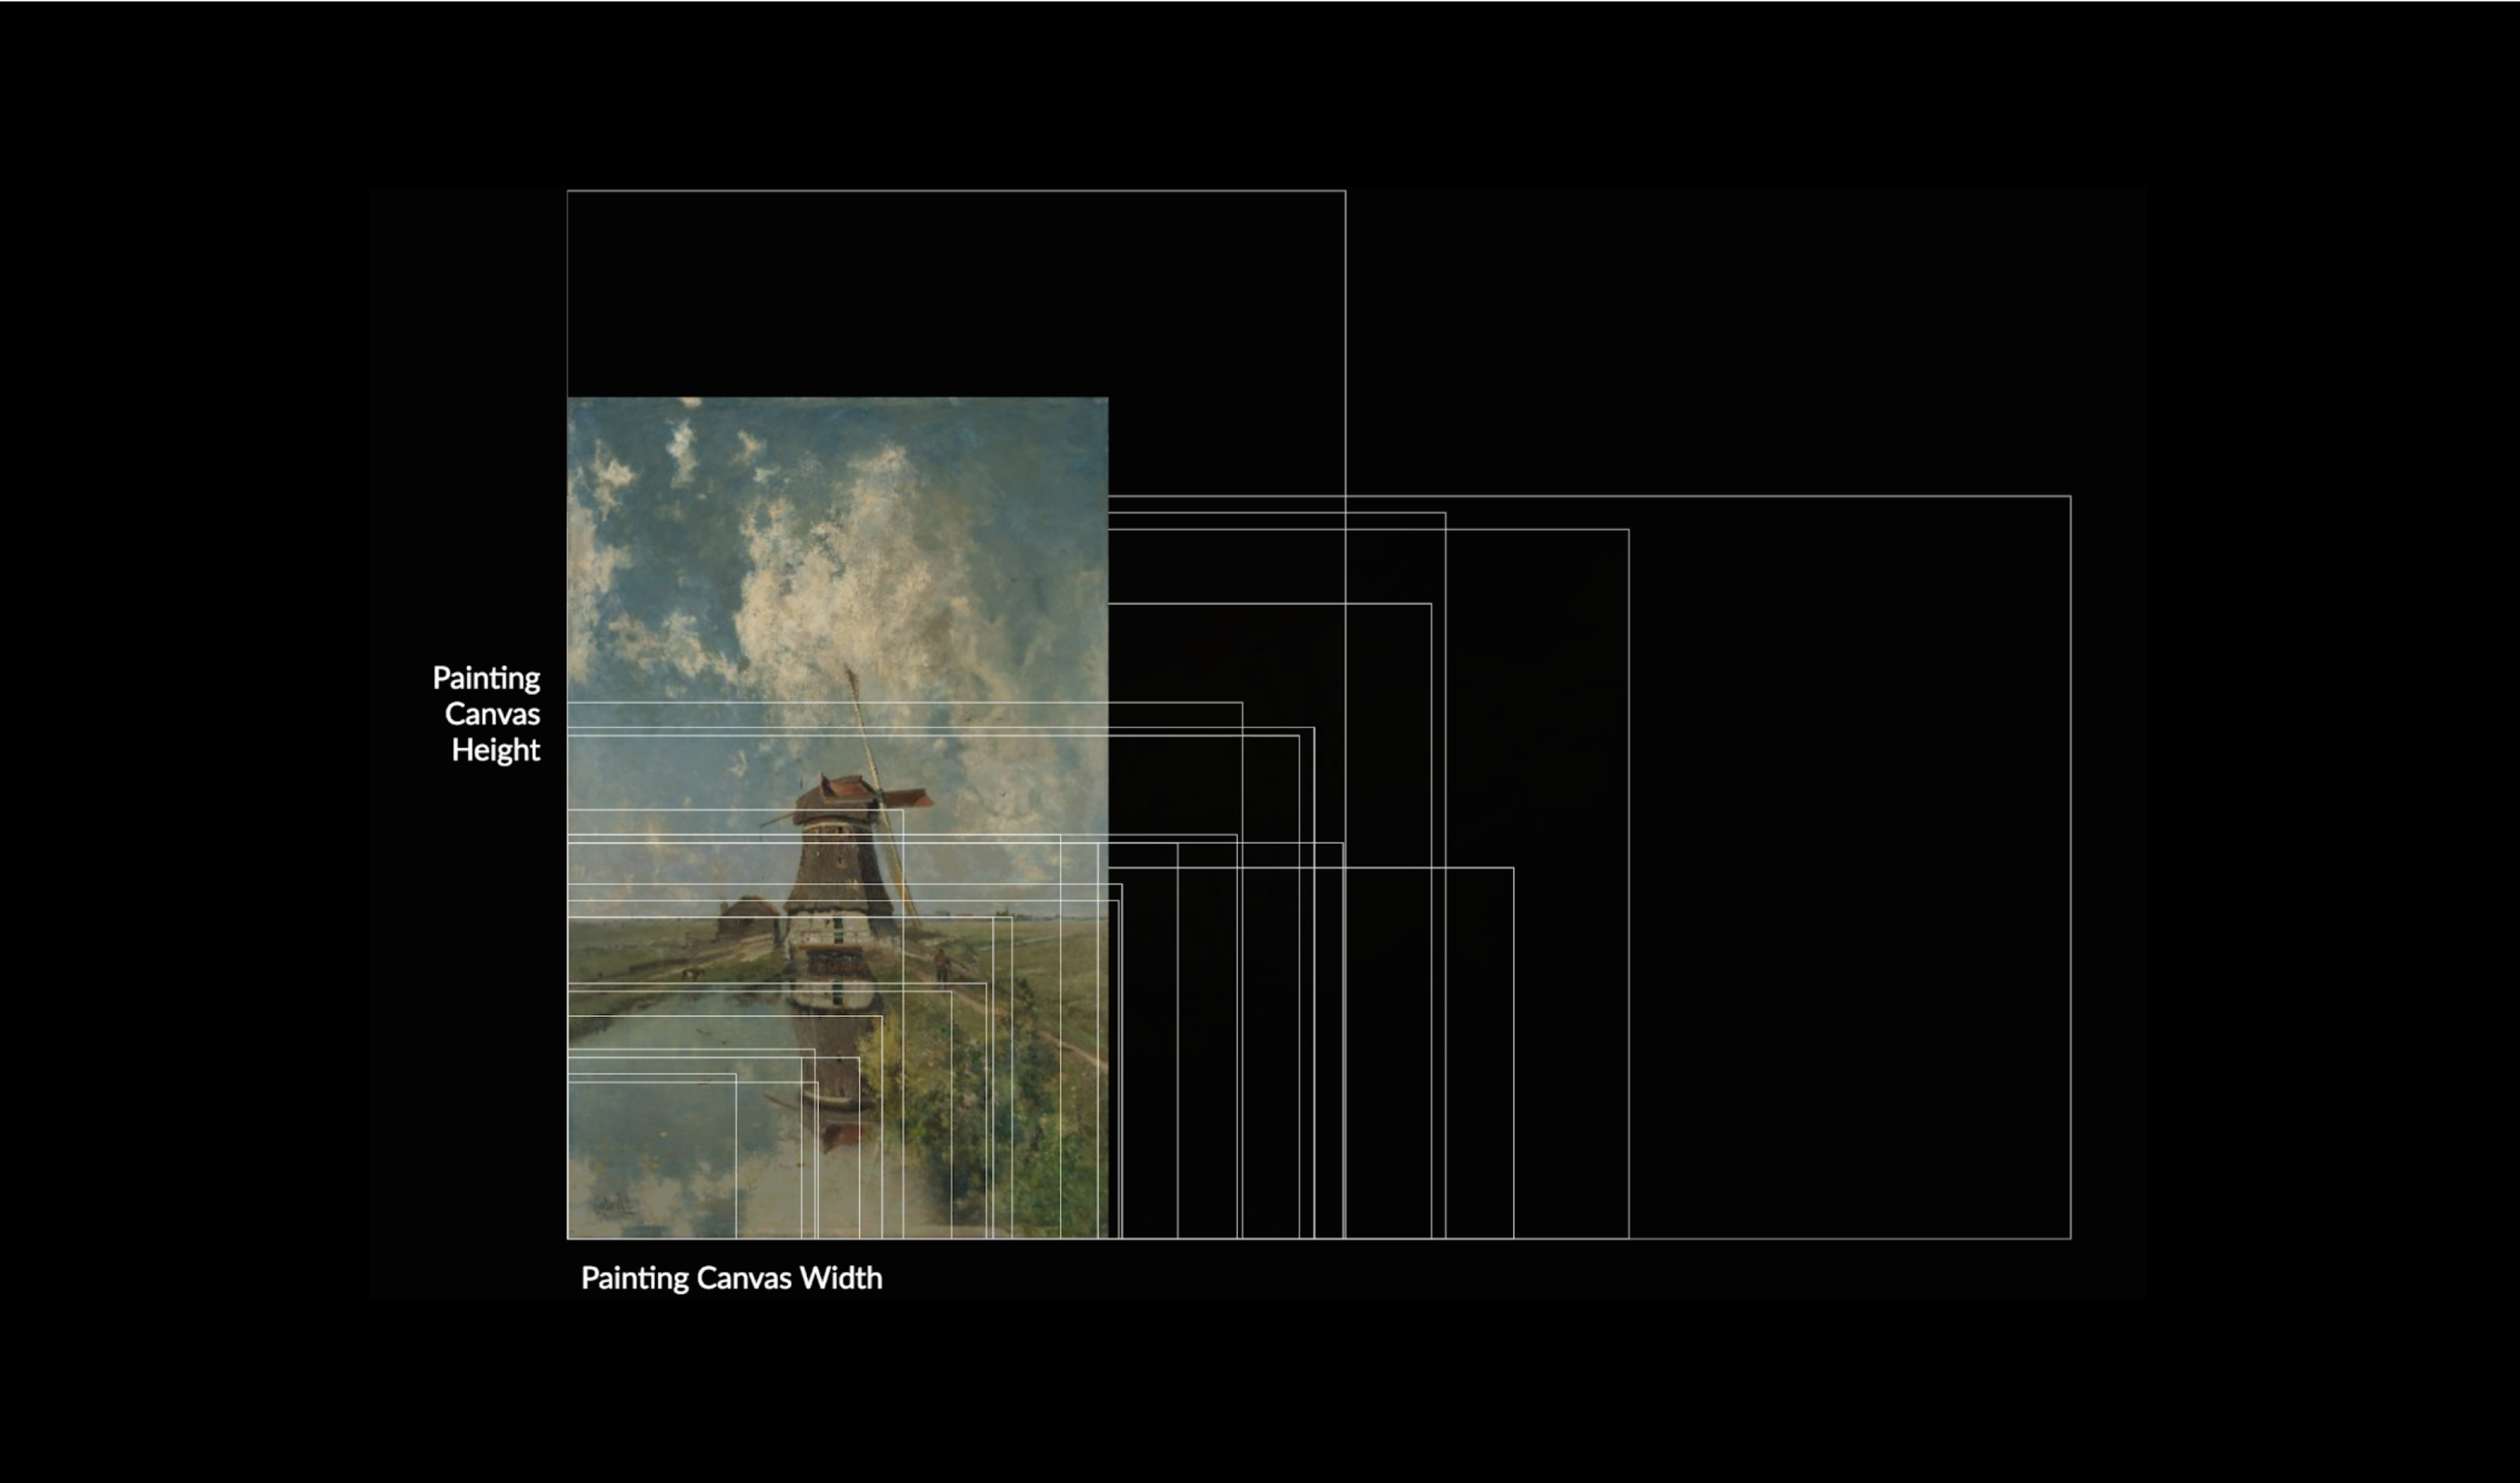
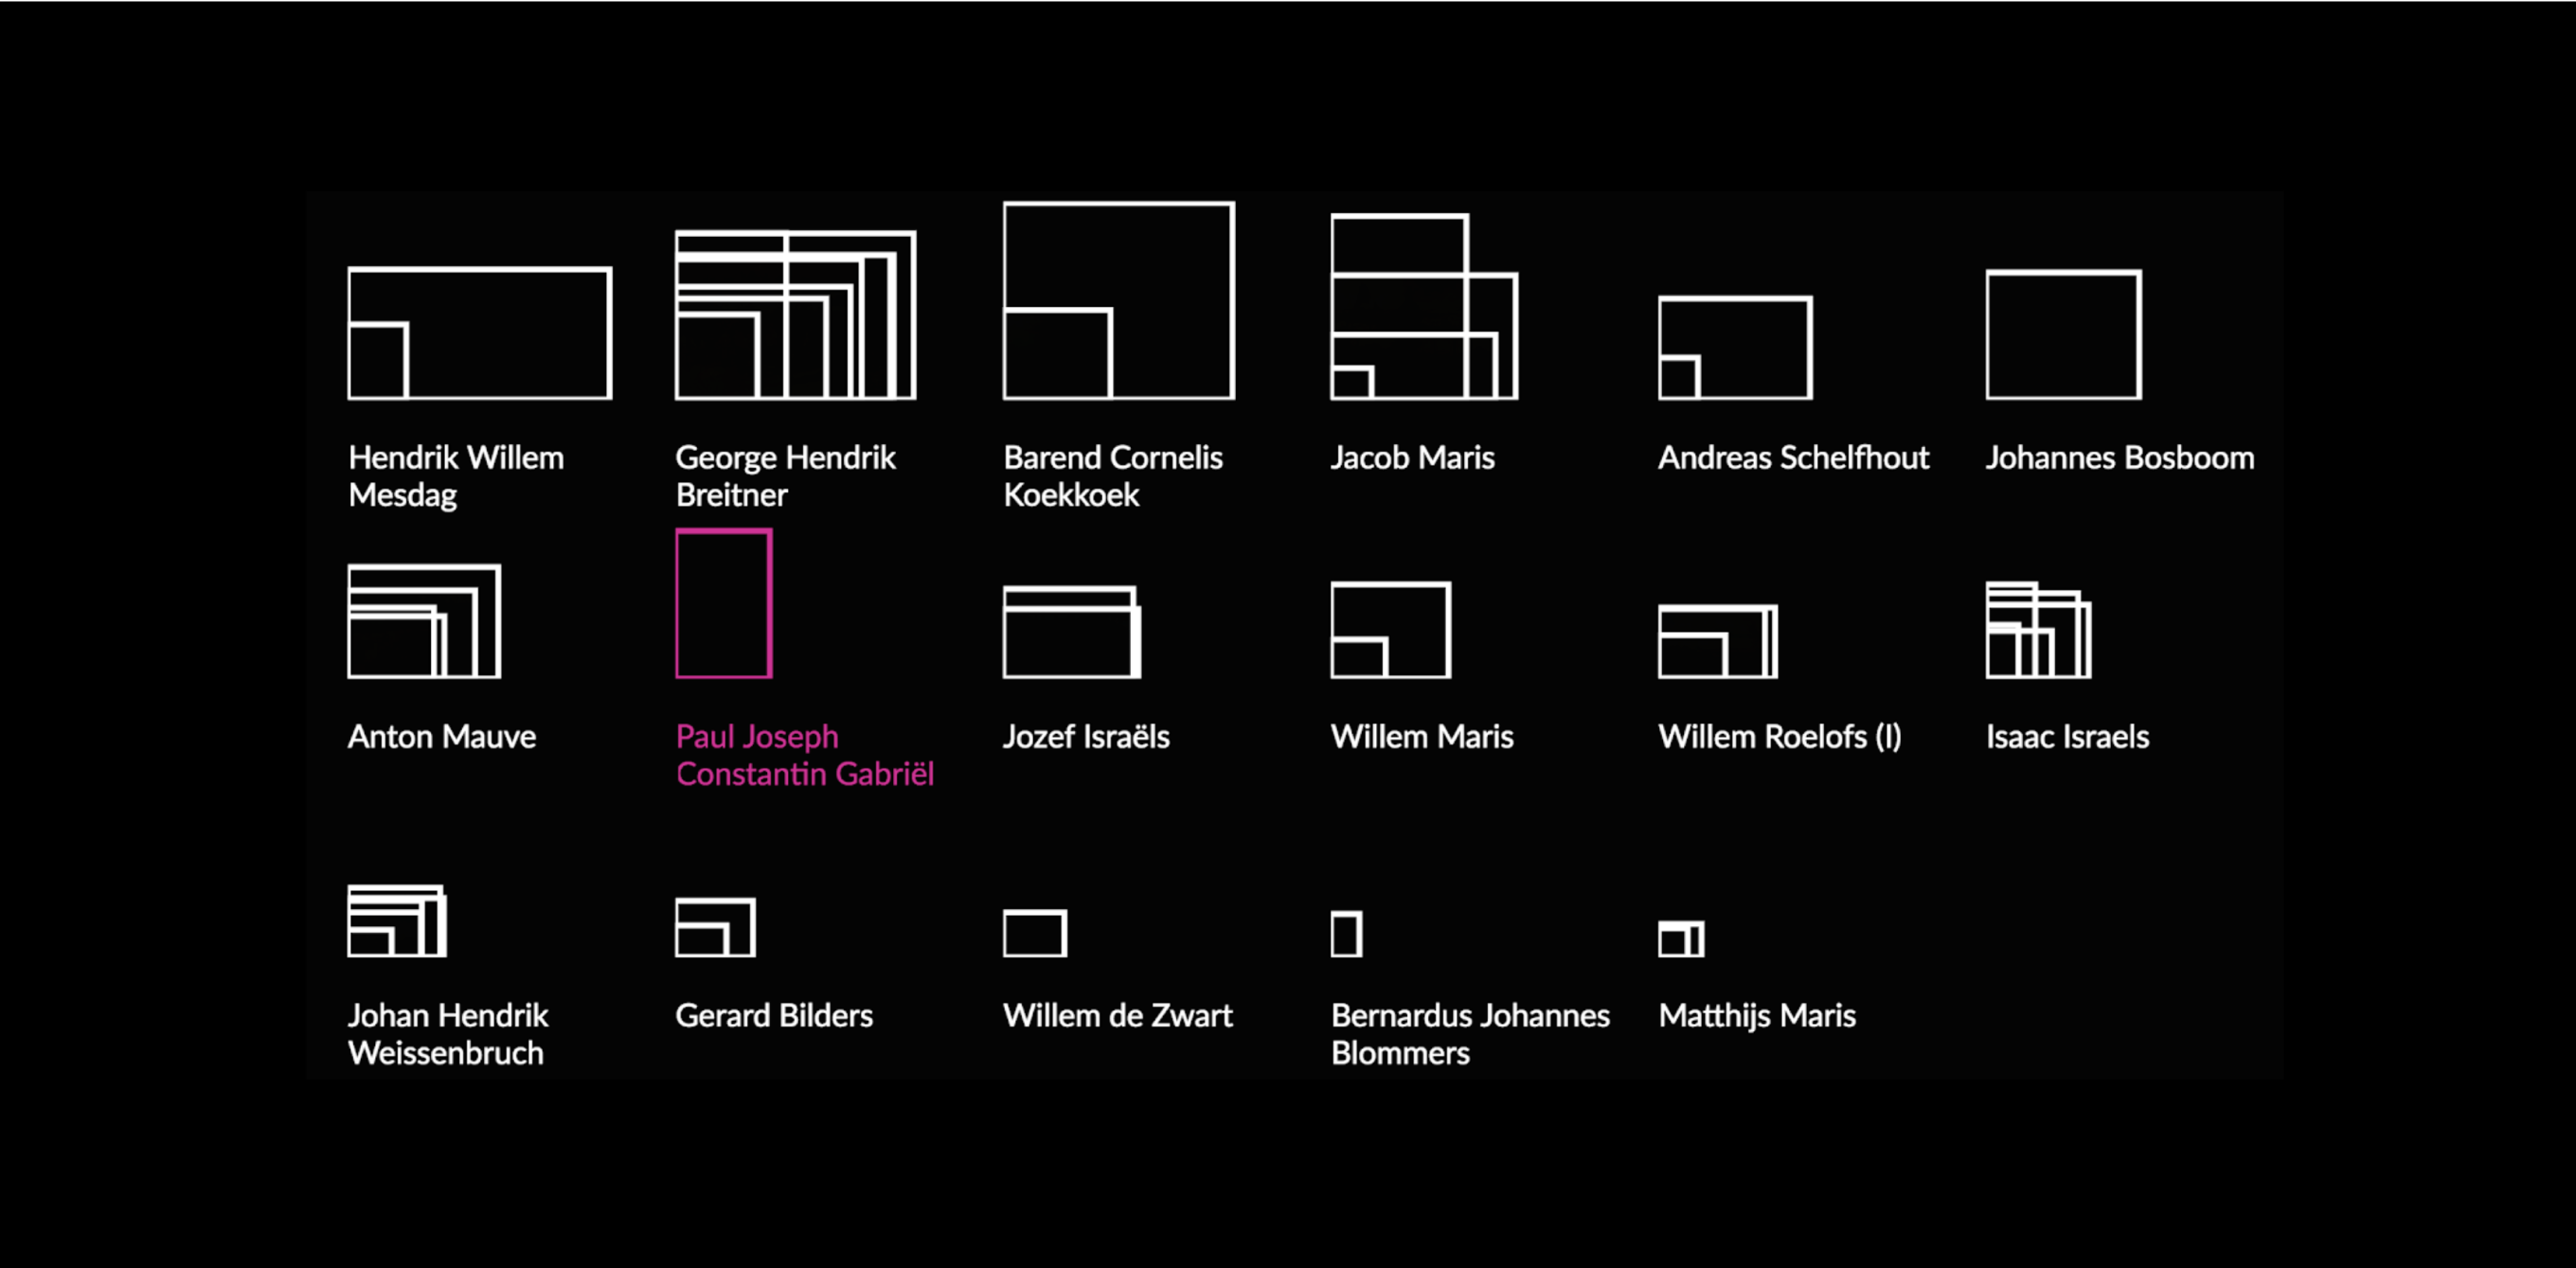
We were interested in the use of color in paintings from The Hague School. We read that over time, the artists transitioned their palettes from gloomy and gray to lighter and brighter, under the influence of Impressionism. To dig into this claim, we pulled a representative color sample of pixels from each painting. We sorted them by hue, saturation, value, and combinations of each, finding hue to be the clearest. Once every painting was summarized into a strip of its colors, we ordered the strips by creation date. (The resulting timeline did not support the claim, but a larger dataset is needed to verify.) To help users to get a feel for the physical scale of the works, we added another dimension. Small multiples showed each artist's preference in terms of their chosen canvas sizes. Hover interactions linked the visualizations together.
Exhibit IV
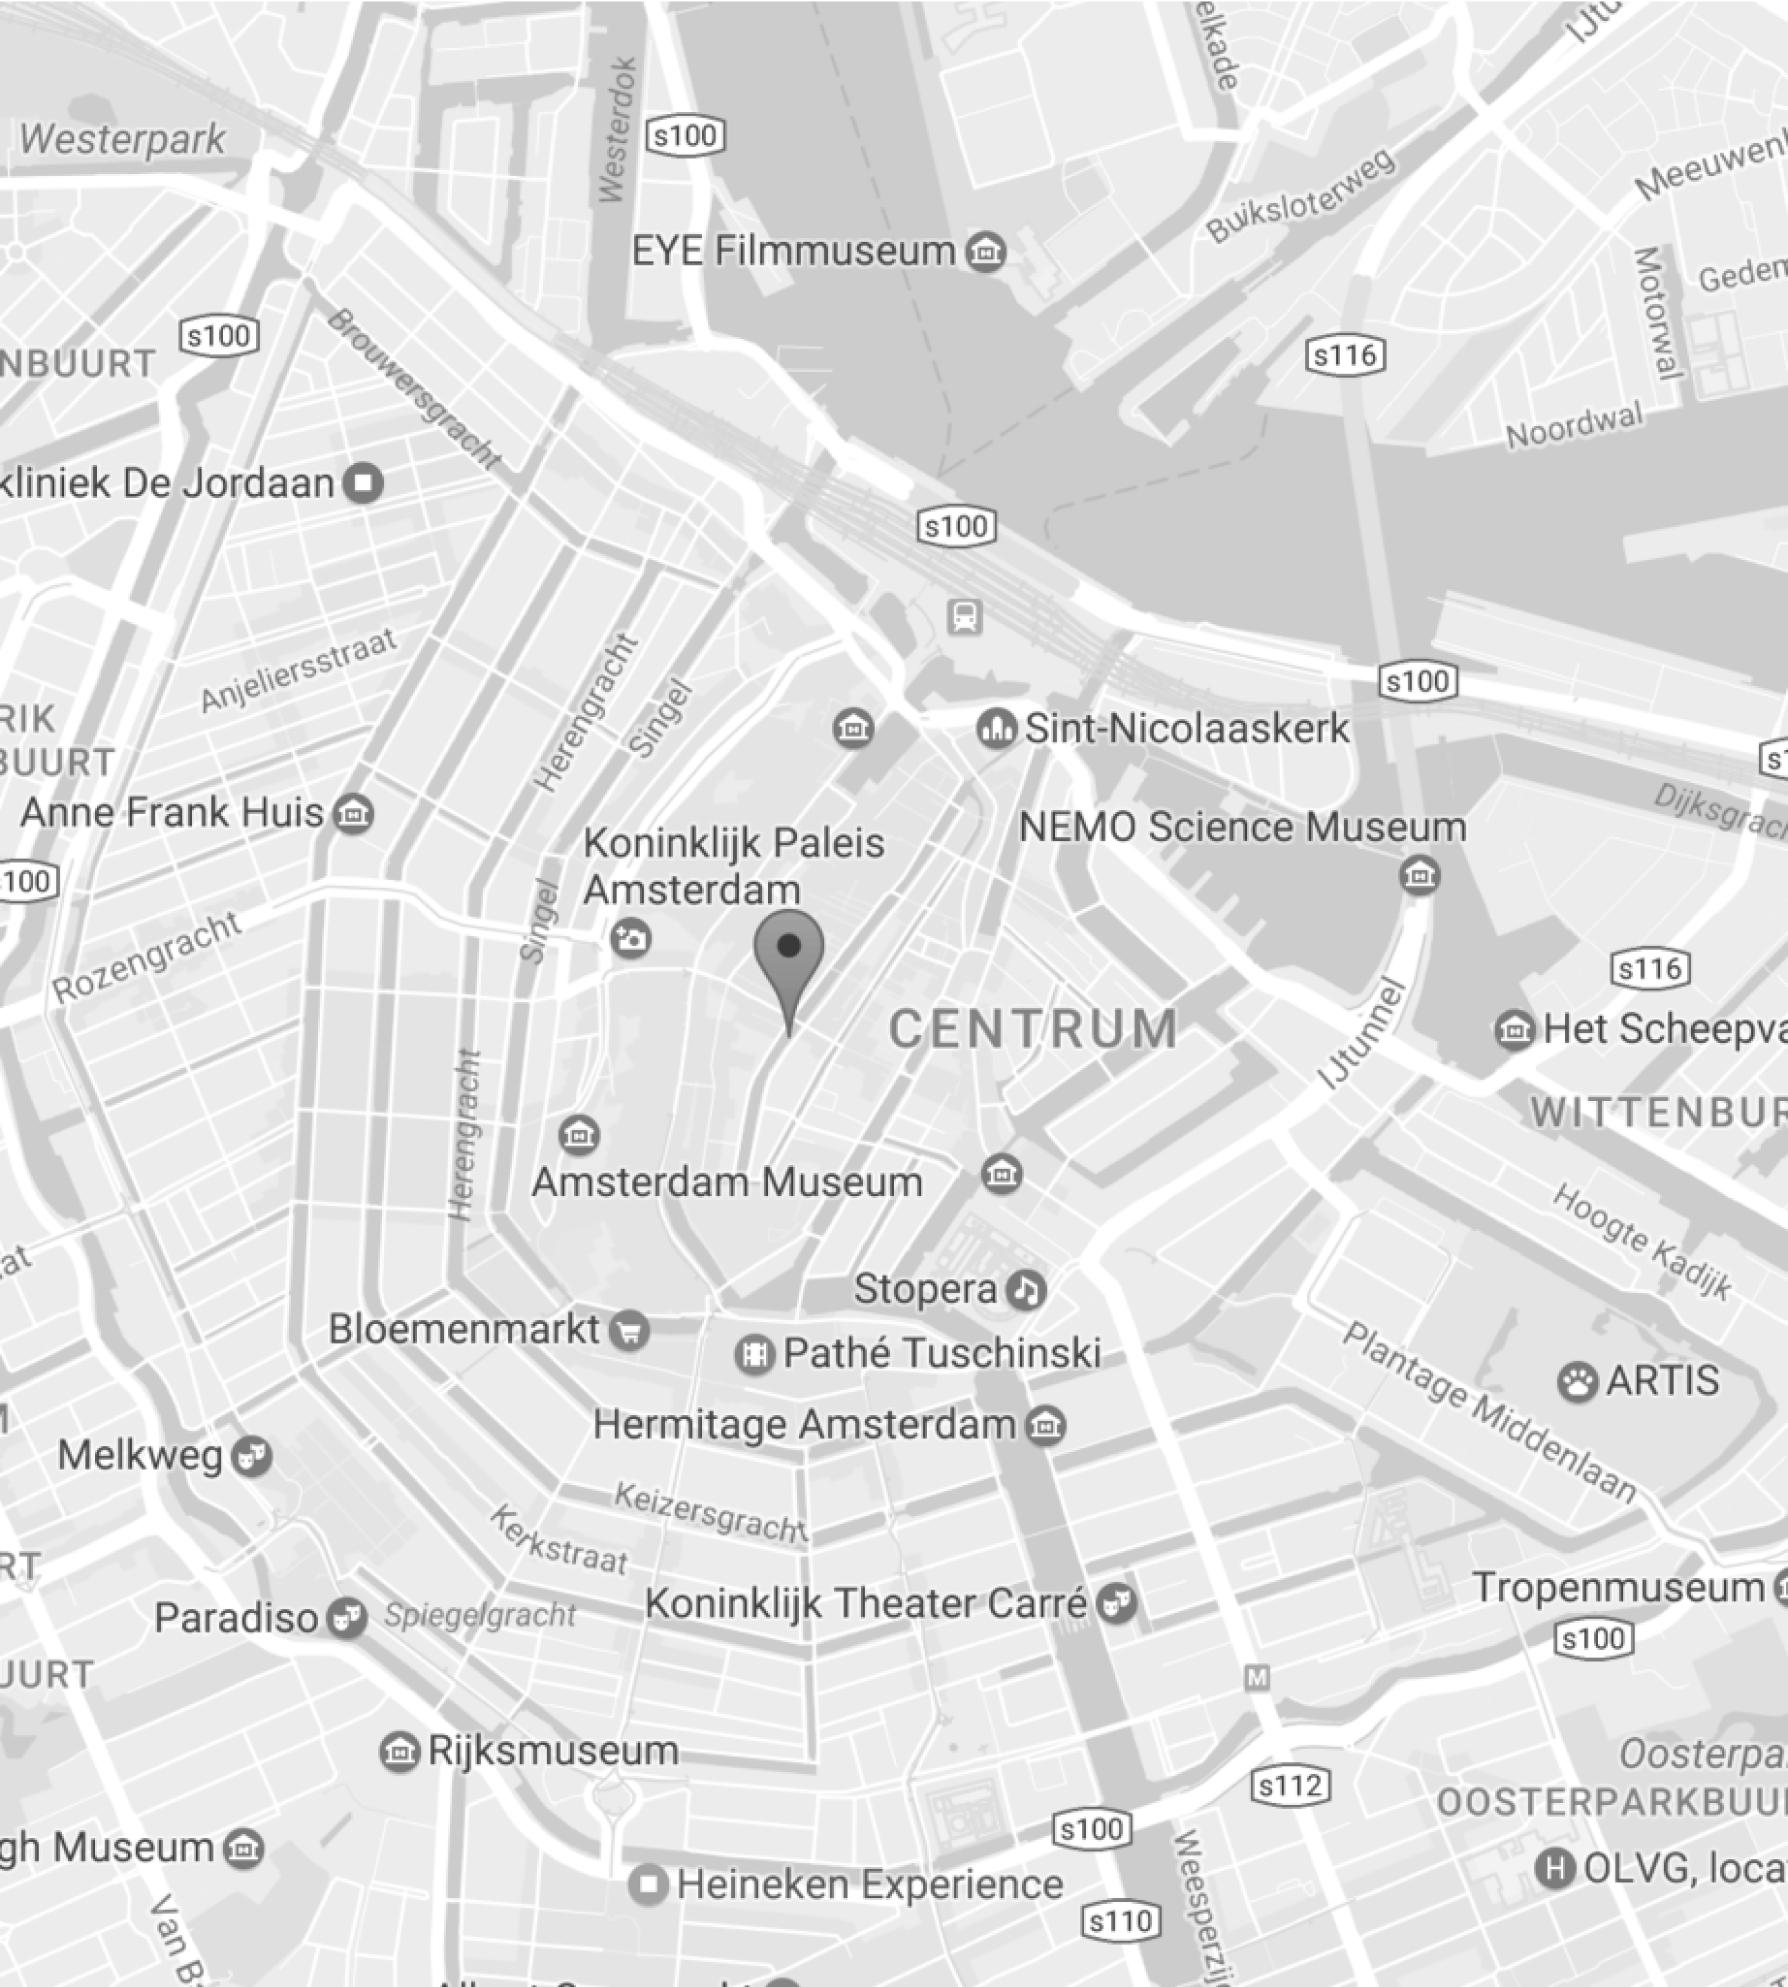
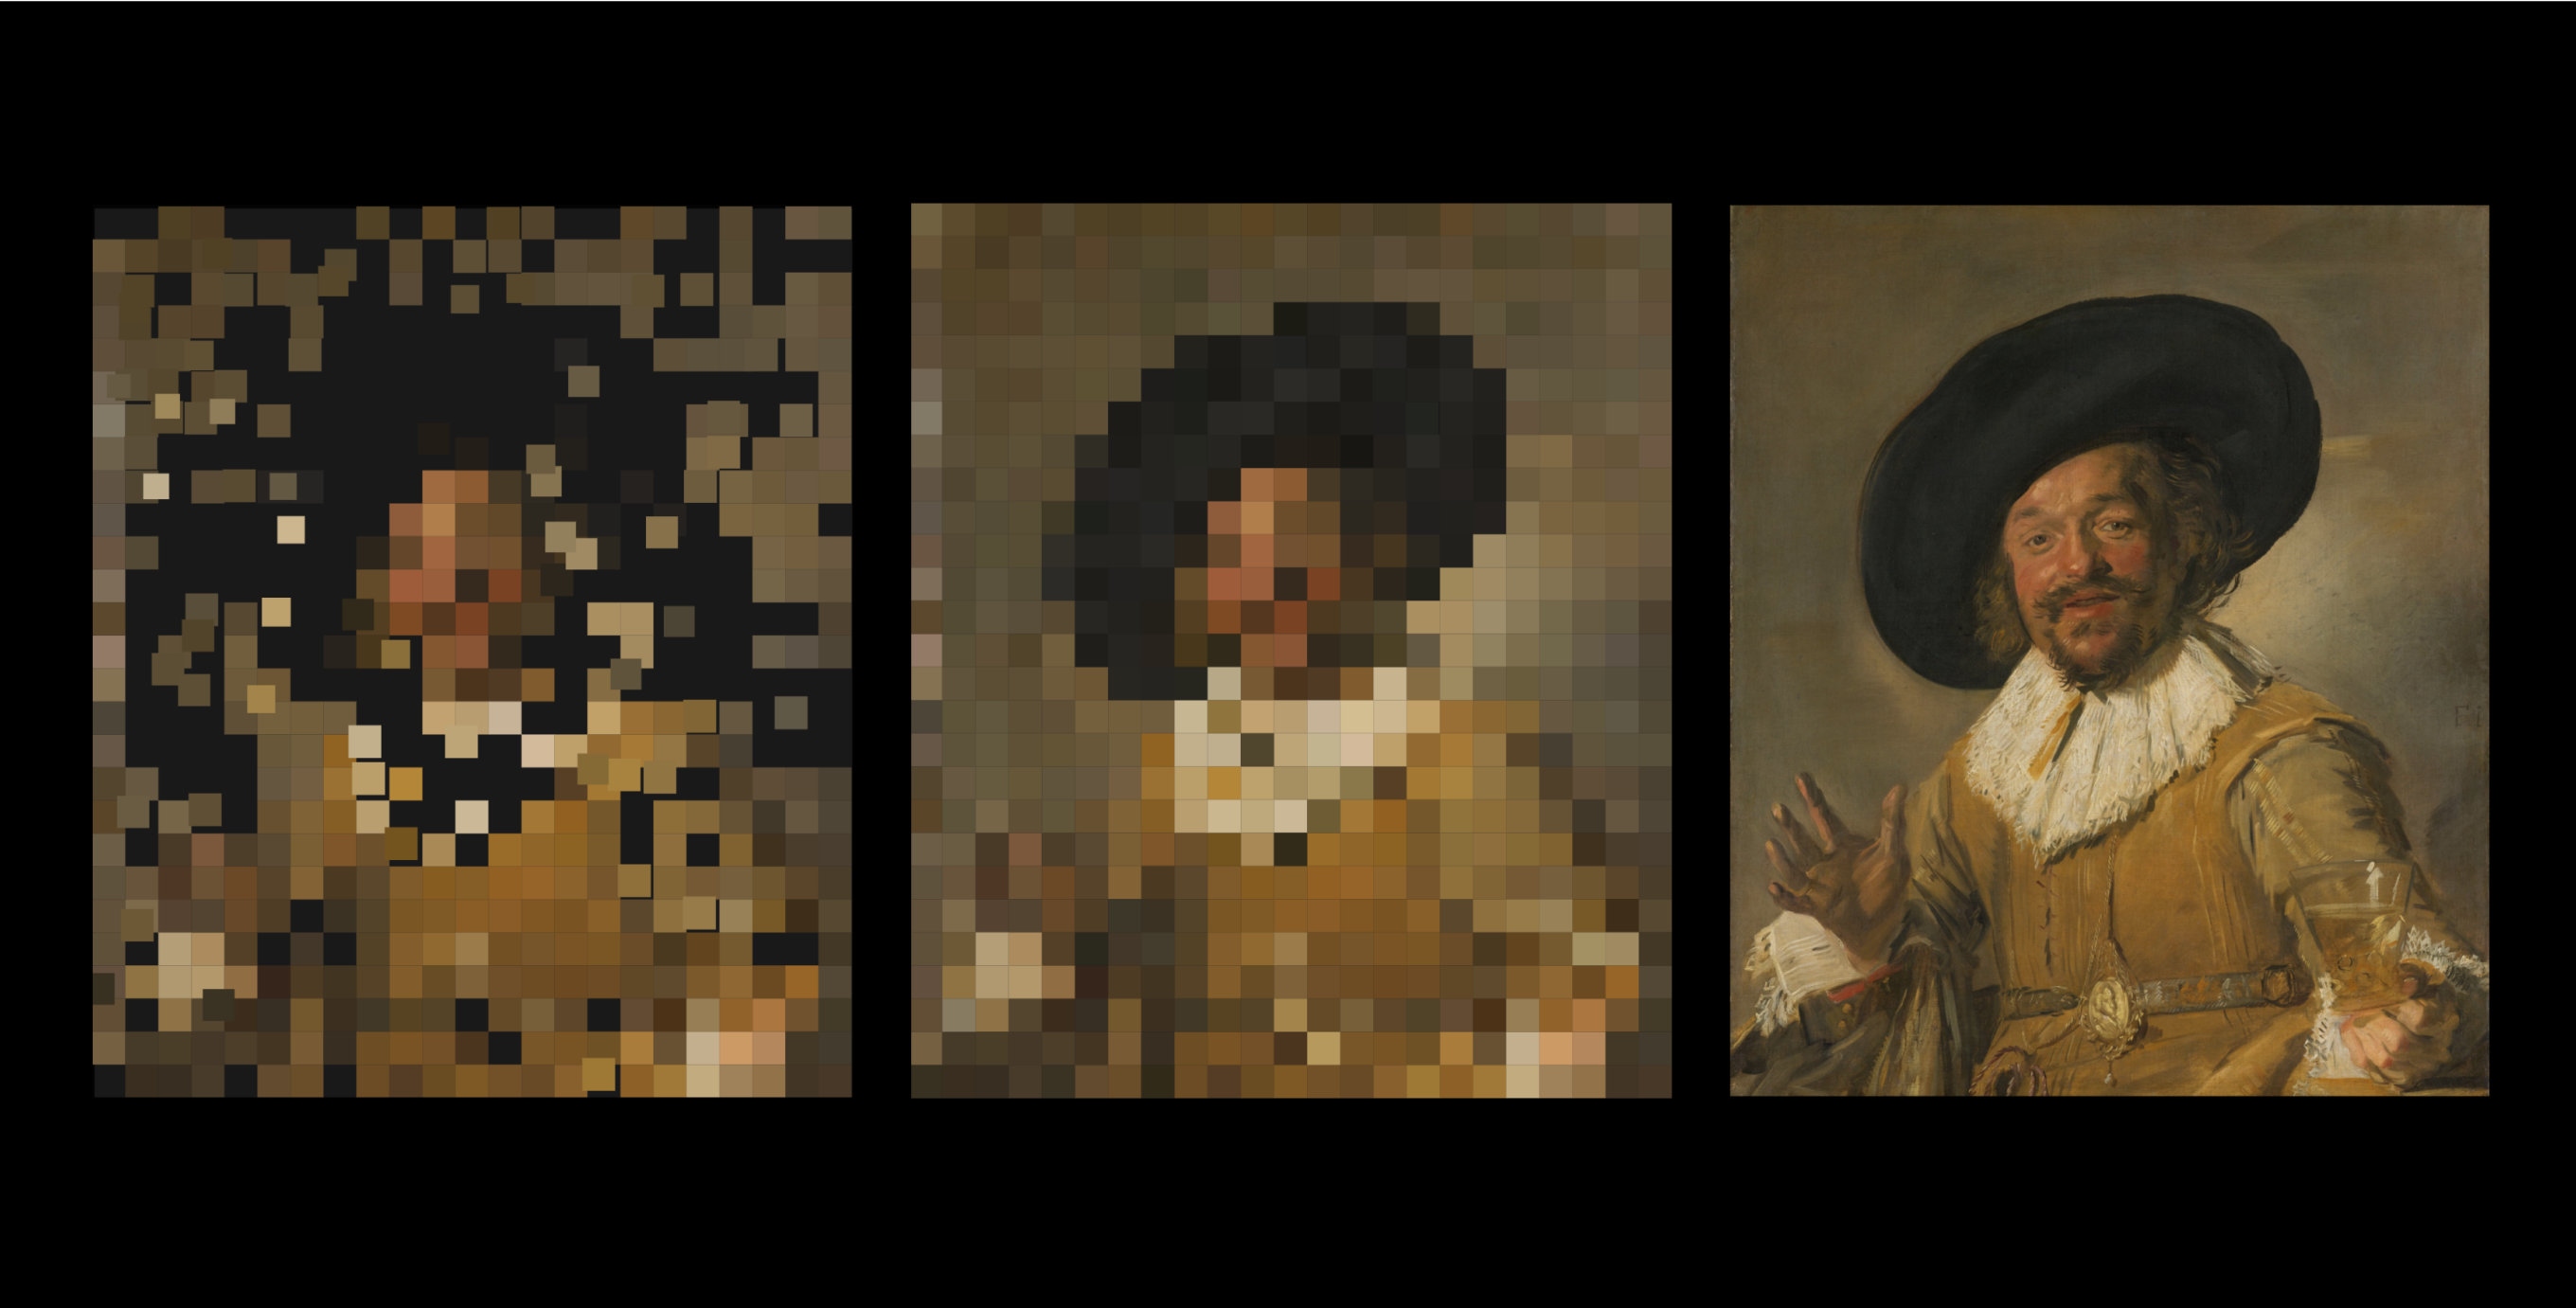
For the final “exhibit,” we introduced gamification, focusing on the paintings that the Rijksmuseum designated “masterpieces” in their API. As many of the paintings are well-known, we wanted to encourage users to guess the work's title and artist as it's slowly revealed. Colorful pixels from a piece gradually make their way to their respective places on the final “canvas.” The pixels flow along the canals of a vectorized map of Amsterdam, to give a sense of place.